Cisco ASR1006 Hardware Installation Guide - Page 175
Feature Change to CPU-Usage show Command
 |
UPC - 882658196423
View all Cisco ASR1006 manuals
Add to My Manuals
Save this manual to your list of manuals |
Page 175 highlights
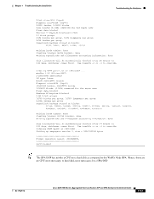
Chapter 7 Troubleshooting the Installation Feature Change to CPU-Usage show Command Feature Change to CPU-Usage show Command To display the current CPU-Usage for a FRU, the show platform software process slot slot monitor cycles cycles interval interval lines lines command is used from the console. The way this command is run on a FRU, is changed from Cisco IOS XE Release 3.4.0s. Old Behavior If lines is specified in the show platform software process slot slot monitor cycles cycles interval interval lines lines command, the results generated and displayed did not reflect accurate CPU utilization at the time. This was because the command was executed as many cycles as specified one cycle at a time. The following example shows the output of the show platform software process slot slot monitor cycles cycles interval interval lines lines command. This command produced inaccurate CPU usage details as illustrated in the following example: Router# show platform software process slot r0 monitor cycles 4 interval 3 lines 5 top - 18:26:00 up 4 min, 0 users, load average: 1.89, 1.97, 0.86 Tasks: 133 total, 2 running, 131 sleeping, 0 stopped, 0 zombie Cpu(s): 34.4%us, 32.3%sy, 0.0%ni, 27.4%id, 3.2%wa, 0.5%hi, 2.2%si, 0.0%st Mem: 3874984k total, 1553444k used, 2321540k free, 102904k buffers Swap: 0k total, 0k used, 0k free, 963120k cached top - 18:26:03 up 4 min, 0 users, load average: 1.89, 1.97, 0.86 Tasks: 133 total, 3 running, 130 sleeping, 0 stopped, 0 zombie Cpu(s): 34.0%us, 31.9%sy, 0.0%ni, 28.3%id, 3.2%wa, 0.5%hi, 2.2%si, 0.0%st Mem: 3874984k total, 1553444k used, 2321540k free, 102904k buffers Swap: 0k total, 0k used, 0k free, 963120k cached top - 18:26:07 up 4 min, 0 users, load average: 1.74, 1.94, 0.86 Tasks: 133 total, 3 running, 130 sleeping, 0 stopped, 0 zombie Cpu(s): 33.6%us, 31.5%sy, 0.0%ni, 29.2%id, 3.1%wa, 0.5%hi, 2.2%si, 0.0%st Mem: 3874984k total, 1553452k used, 2321532k free, 102904k buffers Swap: 0k total, 0k used, 0k free, 963120k cached top - 18:26:10 up 4 min, 0 users, load average: 1.60, 1.91, 0.85 Tasks: 133 total, 2 running, 131 sleeping, 0 stopped, 0 zombie Cpu(s): 33.2%us, 31.1%sy, 0.0%ni, 30.0%id, 3.1%wa, 0.5%hi, 2.2%si, 0.0%st Mem: 3874984k total, 1553452k used, 2321532k free, 102904k buffers Swap: 0k total, 0k used, 0k free, 963124k cached New Behavior The show platform software process slot slot monitor cycles cycles interval interval command produced accurate CPU usage details, if executed without the lines number-of-lines parameters. The show command, if executed without the lines number-of-lines keywords is executed in batch-mode. Note To display accurate CPU usage details, execute the show platform software process slot slot monitor cycles cycles interval interval command without the lines number-of-lines keyword or use the top command top -s -b -n iterations - d interval from Linux shell. OL-14126-12 Cisco ASR 1000 Series Aggregation Services Routers SIP and SPA Hardware Installation Guide 7-15
-
 1
1 -
2
-
3
-
4
-
5
-
6
-
7
-
8
-
9
-
10
-
11
-
12
-
13
-
14
-
15
-
16
-
17
-
18
-
19
-
20
-
21
-
22
-
23
-
24
-
25
-
26
-
27
-
28
-
29
-
30
-
31
-
32
-
33
-
34
-
35
-
36
-
37
-
38
-
39
-
40
-
41
-
42
-
43
-
44
-
45
-
46
-
47
-
48
-
49
-
50
-
51
-
52
-
53
-
54
-
55
-
56
-
57
-
58
-
59
-
60
-
61
-
62
-
63
-
64
-
65
-
66
-
67
-
68
-
69
-
70
-
71
-
72
-
73
-
74
-
75
-
76
-
77
-
78
-
79
-
80
-
81
-
82
-
83
-
84
-
85
-
86
-
87
-
88
-
89
-
90
-
91
-
92
-
93
-
94
-
95
-
96
-
97
-
98
-
99
-
100
-
101
-
102
-
103
-
104
-
105
-
106
-
107
-
108
-
109
-
110
-
111
-
112
-
113
-
114
-
115
-
116
-
117
-
118
-
119
-
120
-
121
-
122
-
123
-
124
-
125
-
126
-
127
-
128
-
129
-
130
-
131
-
132
-
133
-
134
-
135
-
136
-
137
-
138
-
139
-
140
-
141
-
142
-
143
-
144
-
145
-
146
-
147
-
148
-
149
-
150
-
151
-
152
-
153
-
154
-
155
-
156
-
157
-
158
-
159
-
160
-
161
-
162
-
163
-
164
-
165
-
166
-
167
-
168
-
169
-
 170
170 -
 171
171 -
 172
172 -
 173
173 -
 174
174 -
 175
175 -
 176
176 -
 177
177 -
 178
178 -
 179
179 -
 180
180 -
181
-
182
-
183
-
184
-
185
-
186
-
187
-
188
 |
 |