Cisco MDS-9124 Troubleshooting Guide - Page 526
Using On-Board Failure Logging, Using the show system resource CLI Command
 |
View all Cisco MDS-9124 manuals
Add to My Manuals
Save this manual to your list of manuals |
Page 526 highlights
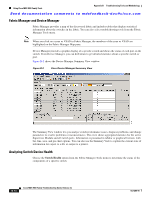
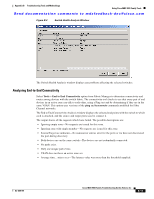
Using Cisco MDS 9000 Family Tools Appendix B Troubleshooting Tools and Methodology Send documentation comments to [email protected] • uSecs = microseconds of CPU time in average for each process invocation. • 1Sec = CPU utilization in percentage for the last one second. Example B-5 show processes cpu Command switch# show processes cpu PID ----1016 1017 1218 1219 1220 1221 1223 1237 1249 1250 1251 1253 1254 Runtime(ms 7 20627 299 25 1558 263 512 313 912 1481 1460 457 138 Invoked -------- 2 2921172 11710 38 6985 11772 8996 29072 18815 6214 68079 29220 6309 uSecs ----3714 7 25 676 223 22 56 10 48 238 21 15 21 1Sec Process 0.0 tftpd 0.0 syslogd 0.0 licmgr 0.0 fs-daemon 0.0 feature-mgr 0.0 fcfwd 0.0 capability 0.0 syslogd 0.0 xbar_client 0.0 wwn 0.0 vsan 0.0 ttyd 0.0 sysinfo Using the show system resource CLI Command Use the show system resources command to display system-related CPU and memory statistics. The output includes the following: • Load is defined as number of running processes. The average reflects the system load over the past 1, 5, and 15 minutes. • Processes displays the number of processes in the system, and how many are actually running when the command is issued. • CPU states shows the CPU usage percentage in user mode, kernel mode, and idle time in the last one second. • Memory usage provides the total memory, used memory, free memory, memory used for buffers, and memory used for cache in KB. Buffers and cache are also included in the used memory statistics. Example B-6 show system resources Command switch# show system resources Load average: Processes : CPU states : Memory usage: 2340K buffers, 1 minute: 0.00 5 minutes: 0.00 15 minutes: 0.00 152 total, 3 running 0.0% user, 0.0% kernel, 100.0% idle 960080K total, 412900K used, 547180K free 292380K cache Using On-Board Failure Logging The Generation 2 Fibre Channel switching modules provide the facility to log failure data to persistent storage, which can be retrieved and displayed for analysis. This on-board failure logging (OBFL) feature stores failure and environmental information in nonvolatile memory on the module. The information will help in post-mortem analysis of failed cards. B-10 Cisco MDS 9000 Family Troubleshooting Guide, Release 3.x OL-9285-05
-
 1
1 -
2
-
3
-
4
-
5
-
6
-
7
-
8
-
9
-
10
-
11
-
12
-
13
-
14
-
15
-
16
-
17
-
18
-
19
-
20
-
21
-
22
-
23
-
24
-
25
-
26
-
27
-
28
-
29
-
30
-
31
-
32
-
33
-
34
-
35
-
36
-
37
-
38
-
39
-
40
-
41
-
42
-
43
-
44
-
45
-
46
-
47
-
48
-
49
-
50
-
51
-
52
-
53
-
54
-
55
-
56
-
57
-
58
-
59
-
60
-
61
-
62
-
63
-
64
-
65
-
66
-
67
-
68
-
69
-
70
-
71
-
72
-
73
-
74
-
75
-
76
-
77
-
78
-
79
-
80
-
81
-
82
-
83
-
84
-
85
-
86
-
87
-
88
-
89
-
90
-
91
-
92
-
93
-
94
-
95
-
96
-
97
-
98
-
99
-
100
-
101
-
102
-
103
-
104
-
105
-
106
-
107
-
108
-
109
-
110
-
111
-
112
-
113
-
114
-
115
-
116
-
117
-
118
-
119
-
120
-
121
-
122
-
123
-
124
-
125
-
126
-
127
-
128
-
129
-
130
-
131
-
132
-
133
-
134
-
135
-
136
-
137
-
138
-
139
-
140
-
141
-
142
-
143
-
144
-
145
-
146
-
147
-
148
-
149
-
150
-
151
-
152
-
153
-
154
-
155
-
156
-
157
-
158
-
159
-
160
-
161
-
162
-
163
-
164
-
165
-
166
-
167
-
168
-
169
-
170
-
171
-
172
-
173
-
174
-
175
-
176
-
177
-
178
-
179
-
180
-
181
-
182
-
183
-
184
-
185
-
186
-
187
-
188
-
189
-
190
-
191
-
192
-
193
-
194
-
195
-
196
-
197
-
198
-
199
-
200
-
201
-
202
-
203
-
204
-
205
-
206
-
207
-
208
-
209
-
210
-
211
-
212
-
213
-
214
-
215
-
216
-
217
-
218
-
219
-
220
-
221
-
222
-
223
-
224
-
225
-
226
-
227
-
228
-
229
-
230
-
231
-
232
-
233
-
234
-
235
-
236
-
237
-
238
-
239
-
240
-
241
-
242
-
243
-
244
-
245
-
246
-
247
-
248
-
249
-
250
-
251
-
252
-
253
-
254
-
255
-
256
-
257
-
258
-
259
-
260
-
261
-
262
-
263
-
264
-
265
-
266
-
267
-
268
-
269
-
270
-
271
-
272
-
273
-
274
-
275
-
276
-
277
-
278
-
279
-
280
-
281
-
282
-
283
-
284
-
285
-
286
-
287
-
288
-
289
-
290
-
291
-
292
-
293
-
294
-
295
-
296
-
297
-
298
-
299
-
300
-
301
-
302
-
303
-
304
-
305
-
306
-
307
-
308
-
309
-
310
-
311
-
312
-
313
-
314
-
315
-
316
-
317
-
318
-
319
-
320
-
321
-
322
-
323
-
324
-
325
-
326
-
327
-
328
-
329
-
330
-
331
-
332
-
333
-
334
-
335
-
336
-
337
-
338
-
339
-
340
-
341
-
342
-
343
-
344
-
345
-
346
-
347
-
348
-
349
-
350
-
351
-
352
-
353
-
354
-
355
-
356
-
357
-
358
-
359
-
360
-
361
-
362
-
363
-
364
-
365
-
366
-
367
-
368
-
369
-
370
-
371
-
372
-
373
-
374
-
375
-
376
-
377
-
378
-
379
-
380
-
381
-
382
-
383
-
384
-
385
-
386
-
387
-
388
-
389
-
390
-
391
-
392
-
393
-
394
-
395
-
396
-
397
-
398
-
399
-
400
-
401
-
402
-
403
-
404
-
405
-
406
-
407
-
408
-
409
-
410
-
411
-
412
-
413
-
414
-
415
-
416
-
417
-
418
-
419
-
420
-
421
-
422
-
423
-
424
-
425
-
426
-
427
-
428
-
429
-
430
-
431
-
432
-
433
-
434
-
435
-
436
-
437
-
438
-
439
-
440
-
441
-
442
-
443
-
444
-
445
-
446
-
447
-
448
-
449
-
450
-
451
-
452
-
453
-
454
-
455
-
456
-
457
-
458
-
459
-
460
-
461
-
462
-
463
-
464
-
465
-
466
-
467
-
468
-
469
-
470
-
471
-
472
-
473
-
474
-
475
-
476
-
477
-
478
-
479
-
480
-
481
-
482
-
483
-
484
-
485
-
486
-
487
-
488
-
489
-
490
-
491
-
492
-
493
-
494
-
495
-
496
-
497
-
498
-
499
-
500
-
501
-
502
-
503
-
504
-
505
-
506
-
507
-
508
-
509
-
510
-
511
-
512
-
513
-
514
-
515
-
516
-
517
-
518
-
519
-
520
-
 521
521 -
 522
522 -
 523
523 -
 524
524 -
 525
525 -
 526
526 -
 527
527 -
 528
528 -
 529
529 -
 530
530 -
 531
531 -
532
-
533
-
534
-
535
-
536
-
537
-
538
-
539
-
540
-
541
-
542
-
543
-
544
-
545
-
546
-
547
-
548
-
549
-
550
-
551
-
552
-
553
-
554
-
555
-
556
-
557
-
558
-
559
-
560
 |
 |