Dell PowerConnect 2848 User's Guide - Page 145
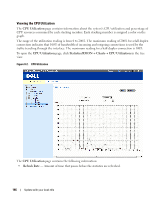
Viewing Charts, CRC & Align Errors
 |
View all Dell PowerConnect 2848 manuals
Add to My Manuals
Save this manual to your list of manuals |
Page 145 highlights
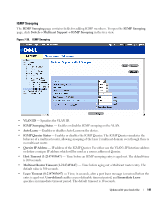
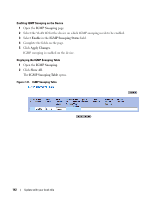
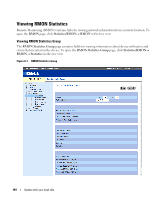
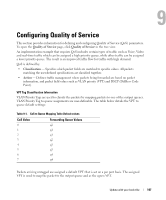
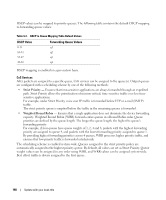
• Interface - Specifies the port or LAG for which statistics are displayed. • Refresh Rate - Amount of time that passes before the statistics are refreshed. • Drop Events - Number of dropped events that have occurred on the interface since the device was last refreshed. • Received Bytes (Octets) - Number of octets received on the interface since the device was last refreshed. This number includes bad packets and FCS octets, but excludes framing bits. • Received Packets - Number of packets received on the interface, including bad packets, Multicast and broadcast packets, since the device was last refreshed. • Broadcast Packets Received - Number of good broadcast packets received on the interface since the device was last refreshed. This number does not include Multicast packets. • Multicast Packets Received - Number of good Multicast packets received on the interface since the device was last refreshed. • CRC & Align Errors - Number of CRC and Align errors that have occurred on the interface since the device was last refreshed. • Undersize Packets - Number of undersized packets (less than 64 octets) received on the interface since the device was last refreshed. • Oversize Packets - Number of oversized packets (over 1518 octets) received on the interface since the device was last refreshed. • Fragments - Number of fragments (packets with less than 64 octets, excluding framing bits, but including FCS octets) received on the interface since the device was last refreshed. • Jabbers - Number of jabbers (packets longer than 1518 octets) received on the interface since the device was last refreshed. • Collisions - Number of collisions received on the interface since the device was last refreshed. • Frames of xx Bytes - Number of xx-byte frames received on the interface since the device was last refreshed. Viewing Interface Statistics 1 Open the RMON Statistics Group page. 2 Select an interface type and number in the Interface field. The interface statistics are displayed. Viewing Charts The Chart page contains links for displaying statistics in a chart form. To open the page, click Statistics→ Charts in the tree view. Update with your book title 145
-
 1
1 -
2
-
3
-
4
-
5
-
6
-
7
-
8
-
9
-
10
-
11
-
12
-
13
-
14
-
15
-
16
-
17
-
18
-
19
-
20
-
21
-
22
-
23
-
24
-
25
-
26
-
27
-
28
-
29
-
30
-
31
-
32
-
33
-
34
-
35
-
36
-
37
-
38
-
39
-
40
-
41
-
42
-
43
-
44
-
45
-
46
-
47
-
48
-
49
-
50
-
51
-
52
-
53
-
54
-
55
-
56
-
57
-
58
-
59
-
60
-
61
-
62
-
63
-
64
-
65
-
66
-
67
-
68
-
69
-
70
-
71
-
72
-
73
-
74
-
75
-
76
-
77
-
78
-
79
-
80
-
81
-
82
-
83
-
84
-
85
-
86
-
87
-
88
-
89
-
90
-
91
-
92
-
93
-
94
-
95
-
96
-
97
-
98
-
99
-
100
-
101
-
102
-
103
-
104
-
105
-
106
-
107
-
108
-
109
-
110
-
111
-
112
-
113
-
114
-
115
-
116
-
117
-
118
-
119
-
120
-
121
-
122
-
123
-
124
-
125
-
126
-
127
-
128
-
129
-
130
-
131
-
132
-
133
-
134
-
135
-
136
-
137
-
138
-
139
-
 140
140 -
 141
141 -
 142
142 -
 143
143 -
 144
144 -
 145
145 -
 146
146 -
 147
147 -
 148
148 -
 149
149 -
 150
150 -
151
-
152
-
153
-
154
-
155
-
156
-
157
-
158
-
159
-
160
-
161
-
162
-
163
-
164
-
165
-
166
-
167
-
168
-
169
-
170
-
171
-
172
-
173
-
174
-
175
-
176
-
177
-
178
-
179
-
180
-
181
-
182
-
183
-
184
-
185
-
186
 |
 |