Dell PowerVault NX3500 Administrator's Guide - Page 63
Monitoring PowerVault NX3500
 |
View all Dell PowerVault NX3500 manuals
Add to My Manuals
Save this manual to your list of manuals |
Page 63 highlights
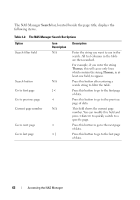
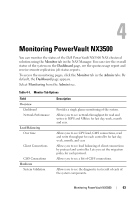
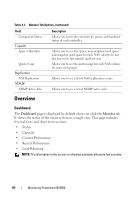
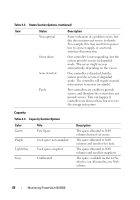
4 Monitoring PowerVault NX3500 You can monitor the status of the Dell PowerVault NX3500 NAS clustered solution using the Monitor tab in the NAS Manager. You can view the overall status of the system on the Dashboard page, see the quotas usage report and receive remote replication job status reports. To access the monitoring pages, click the Monitor tab in the Admin tabs. By default, the Dashboard page appears. Select Monitoring from the Admin tree. Table 4-1. Monitor Tab Options Field Overview Dashboard Network Performance Load Balancing Over time Client Connections CIFS Connections Hardware System Validation Description Provides a single glance monitoring of the system. Allows you to see network throughput for read and writes in IOPS and MB/sec for last day, week, month and year. Allows you to see CPU load, CIFS connections, read and write throughput for each controller for last day, week, month, and year. Allows you to see load balancing of client connections by protocol and controller. Lets you set the migration policy for each protocol. Allows you to see a list of CIFS connections. Allows you to see the diagnostic test result of each of the system components. Monitoring PowerVault NX3500 63
-
 1
1 -
2
-
3
-
4
-
5
-
6
-
7
-
8
-
9
-
10
-
11
-
12
-
13
-
14
-
15
-
16
-
17
-
18
-
19
-
20
-
21
-
22
-
23
-
24
-
25
-
26
-
27
-
28
-
29
-
30
-
31
-
32
-
33
-
34
-
35
-
36
-
37
-
38
-
39
-
40
-
41
-
42
-
43
-
44
-
45
-
46
-
47
-
48
-
49
-
50
-
51
-
52
-
53
-
54
-
55
-
56
-
57
-
 58
58 -
 59
59 -
 60
60 -
 61
61 -
 62
62 -
 63
63 -
 64
64 -
 65
65 -
 66
66 -
 67
67 -
 68
68 -
69
-
70
-
71
-
72
-
73
-
74
-
75
-
76
-
77
-
78
-
79
-
80
-
81
-
82
-
83
-
84
-
85
-
86
-
87
-
88
-
89
-
90
-
91
-
92
-
93
-
94
-
95
-
96
-
97
-
98
-
99
-
100
-
101
-
102
-
103
-
104
-
105
-
106
-
107
-
108
-
109
-
110
-
111
-
112
-
113
-
114
-
115
-
116
-
117
-
118
-
119
-
120
-
121
-
122
-
123
-
124
-
125
-
126
-
127
-
128
-
129
-
130
-
131
-
132
-
133
-
134
-
135
-
136
-
137
-
138
-
139
-
140
-
141
-
142
-
143
-
144
-
145
-
146
-
147
-
148
-
149
-
150
-
151
-
152
-
153
-
154
-
155
-
156
-
157
-
158
-
159
-
160
-
161
-
162
-
163
-
164
-
165
-
166
-
167
-
168
-
169
-
170
-
171
-
172
-
173
-
174
-
175
-
176
-
177
-
178
-
179
-
180
-
181
-
182
-
183
-
184
-
185
-
186
-
187
-
188
-
189
-
190
-
191
-
192
-
193
-
194
-
195
-
196
-
197
-
198
 |
 |