Dell PowerVault NX3500 Administrator's Guide - Page 67
Current Performance, Network Performance, Load Balancing
 |
View all Dell PowerVault NX3500 manuals
Add to My Manuals
Save this manual to your list of manuals |
Page 67 highlights
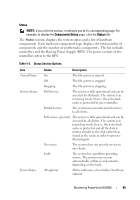
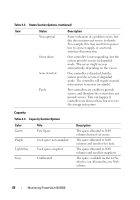
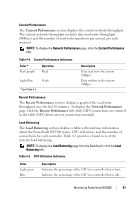
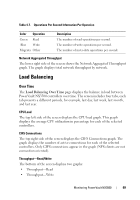
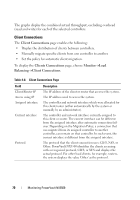
Current Performance The Current Performance section displays the current network throughput. The current network throughput includes data read-write throughput (MB/sec) and the number of read-write operations per second, per each protocol. NOTE: To display the Network Performance page, click the Current Performance title. Table 4-4. Current Performance Indicators Color * Dark purple Operation Read Light Blue Write * See Table 4-5. Description Data read from the system (MBps). Data written to the system (MBps). Recent Performance The Recent Performance section displays a graph of the read-write throughput over the last 30 minutes. To display the Network Performance page, click the Recent Performance title.Only CIFS connections are counted in the table (NFS clients are not connection-oriented). Load Balancing The Load Balancing section displays a table with real-time information about the PowerVault NX3500 status, CPU utilization, and the number of connections for each controller. Table 4-5 provides a broad view of the system's load balancing. NOTE: To display the Load Balancing page from the Dashboard, click the Load Balancing title. Table 4-5. CPU Utilization Indicators Color Light green Blue Description Indicates the percentage of the CPU in a controller that is busy. Indicates the percentage of the CPU in a controller that is idle. Monitoring PowerVault NX3500 67
-
 1
1 -
2
-
3
-
4
-
5
-
6
-
7
-
8
-
9
-
10
-
11
-
12
-
13
-
14
-
15
-
16
-
17
-
18
-
19
-
20
-
21
-
22
-
23
-
24
-
25
-
26
-
27
-
28
-
29
-
30
-
31
-
32
-
33
-
34
-
35
-
36
-
37
-
38
-
39
-
40
-
41
-
42
-
43
-
44
-
45
-
46
-
47
-
48
-
49
-
50
-
51
-
52
-
53
-
54
-
55
-
56
-
57
-
58
-
59
-
60
-
61
-
 62
62 -
 63
63 -
 64
64 -
 65
65 -
 66
66 -
 67
67 -
 68
68 -
 69
69 -
 70
70 -
 71
71 -
 72
72 -
73
-
74
-
75
-
76
-
77
-
78
-
79
-
80
-
81
-
82
-
83
-
84
-
85
-
86
-
87
-
88
-
89
-
90
-
91
-
92
-
93
-
94
-
95
-
96
-
97
-
98
-
99
-
100
-
101
-
102
-
103
-
104
-
105
-
106
-
107
-
108
-
109
-
110
-
111
-
112
-
113
-
114
-
115
-
116
-
117
-
118
-
119
-
120
-
121
-
122
-
123
-
124
-
125
-
126
-
127
-
128
-
129
-
130
-
131
-
132
-
133
-
134
-
135
-
136
-
137
-
138
-
139
-
140
-
141
-
142
-
143
-
144
-
145
-
146
-
147
-
148
-
149
-
150
-
151
-
152
-
153
-
154
-
155
-
156
-
157
-
158
-
159
-
160
-
161
-
162
-
163
-
164
-
165
-
166
-
167
-
168
-
169
-
170
-
171
-
172
-
173
-
174
-
175
-
176
-
177
-
178
-
179
-
180
-
181
-
182
-
183
-
184
-
185
-
186
-
187
-
188
-
189
-
190
-
191
-
192
-
193
-
194
-
195
-
196
-
197
-
198
 |
 |