Garmin GPSMAP 441s Owner's Manual - Page 16
Understanding How Wind VMG and Waypoint, VMG Appear in the Data Bars, Understanding Chart Data - w transducer
 |
View all Garmin GPSMAP 441s manuals
Add to My Manuals
Save this manual to your list of manuals |
Page 16 highlights
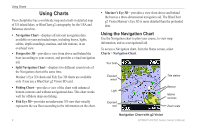
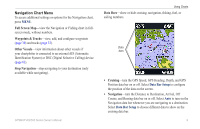
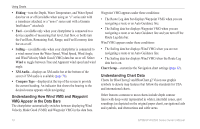
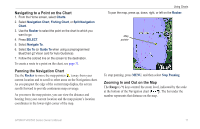
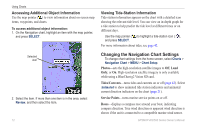
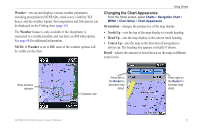
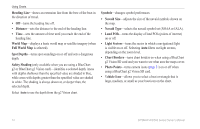
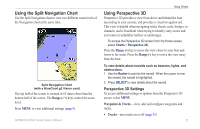
Using Charts • Fishing-turn the Depth, Water Temperature, and Water Speed data bar on or off (available when using an "s" series unit with a transducer attached, or a "non-s" series unit with a Garmin Intelliducer™ attached). • Fuel-(available only when your chartplotter is connected to a device capable of measuring fuel level, fuel flow, or both) turn the Fuel Rate, Remaining Fuel, Range, and Fuel Economy data bar on or off. • Sailing- (available only when your chartplotter is connected to a wind sensor) turn the Water Speed, Wind Speed, Wind Angle, and Wind Velocity Made Good (VMG) data bar on or off. Select Wind to toggle between True and Apparent wind speed and wind angle. • XM Audio-displays an XM audio bar at the bottom of the screen if XM audio is available (page 76). • Compass Tape-displayed at the top of the screen to provide the current heading. An indicator that shows the bearing to the desired course appears while navigating. Understanding How Wind VMG and Waypoint VMG Appear in the Data Bars The chartplotter automatically switches between displaying Wind Velocity Made Good (VMG) and Waypoint VMG in the data bars. Waypoint VMG appears under these conditions: • The Route Leg data bar displays Waypoint VMG when you are navigating a route or an Auto Guidance line. • The Sailing data bar displays Waypoint VMG when you are navigating a route or an Auto Guidance line and you turn off the Route Leg data bar. Wind VMG appears under these conditions: • The Sailing data bar displays Wind VMG when you are not navigating a route or an Auto Guidance line. • The Sailing data bar displays Wind VMG when the Route Leg data bar is on. Chart Setup-customize the Navigation chart settings (page 12). Understanding Chart Data Charts for BlueChart g2 and BlueChart g2 Vision use graphic symbols to denote map features that follow the standards for USA and international charts. Other features common to most charts include depth contour lines (with deep water represented in white), intertidal zones, spot soundings (as depicted on the original paper chart), navigational aids and symbols, and obstructions and cable areas. 10 GPSMAP 400/500 Series Owner's Manual
-
 1
1 -
2
-
3
-
4
-
5
-
6
-
7
-
8
-
9
-
10
-
 11
11 -
 12
12 -
 13
13 -
 14
14 -
 15
15 -
 16
16 -
 17
17 -
 18
18 -
 19
19 -
 20
20 -
 21
21 -
22
-
23
-
24
-
25
-
26
-
27
-
28
-
29
-
30
-
31
-
32
-
33
-
34
-
35
-
36
-
37
-
38
-
39
-
40
-
41
-
42
-
43
-
44
-
45
-
46
-
47
-
48
-
49
-
50
-
51
-
52
-
53
-
54
-
55
-
56
-
57
-
58
-
59
-
60
-
61
-
62
-
63
-
64
-
65
-
66
-
67
-
68
-
69
-
70
-
71
-
72
-
73
-
74
-
75
-
76
-
77
-
78
-
79
-
80
-
81
-
82
-
83
-
84
-
85
-
86
-
87
-
88
-
89
-
90
-
91
-
92
-
93
-
94
-
95
-
96
 |
 |