Garmin GPSMAP 740/740s Owner's Manual - Page 25
Animated Tide and Current Indicators, Detailed Road and Point of Interest Data, Auto Guidance
 |
View all Garmin GPSMAP 740/740s manuals
Add to My Manuals
Save this manual to your list of manuals |
Page 25 highlights
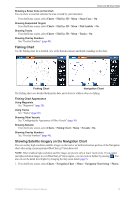
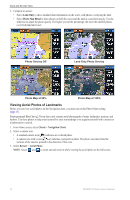
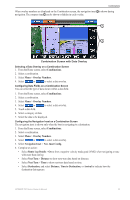
Charts and 3D Chart Views Animated Tide and Current Indicators You can view indicators for animated tide station and current direction on the Navigation chart or the Fishing chart. To do so, information for tide station and current direction must be available in your preloaded map or BlueChart g2 Vision region. You must also select the Animated value for the Tides/Currents setting (page 8). An indicator for a tide station appears on the chart as a vertical bar graph with an arrow. A red arrow pointing downward indicates a falling tide, and a blue arrow pointing upward indicates a rising tide. When you move the cursor over the tide station indicator, the height of the tide at the station appears above the station indicator. Tide Station Current direction indicators appear as arrows on the chart. The direction of each arrow indicates with Falling the direction of the current at a specific location on the chart. The color of the current arrow Tide indicates the range of speed for the current at that location. When you move the cursor over the current direction indicator, the specific current speed at the location appears above the direction indicator. Direction Indicator Color Yellow Orange Red Current Speed Range 0 to 1 knot 1 to 2 knots 2 or more knots Viewing Current Station Information See "Current Information" (page 37). Detailed Road and Point of Interest Data BlueChart g2 Vision contains detailed road and point of interest (POI) data, which includes highly detailed coastal roads and POIs such as restaurants, lodging, local attractions, and more. Searching for, and Navigating to, POIs See "Where To?" (page 33). Auto Guidance Auto Guidance automatically creates and suggests the best path to a destination, based on available BlueChart g2 Vision chart information. Auto Guidance is available when you navigate to a destination using Guide To (page 26). Configuring Auto Guidance Settings See "Auto Guidance Line Configurations" (page 45). GPSMAP 700 Series Owner's Manual 21
-
 1
1 -
2
-
3
-
4
-
5
-
6
-
7
-
8
-
9
-
10
-
11
-
12
-
13
-
14
-
15
-
16
-
17
-
18
-
19
-
 20
20 -
 21
21 -
 22
22 -
 23
23 -
 24
24 -
 25
25 -
 26
26 -
 27
27 -
 28
28 -
 29
29 -
 30
30 -
31
-
32
-
33
-
34
-
35
-
36
-
37
-
38
-
39
-
40
-
41
-
42
-
43
-
44
-
45
-
46
-
47
-
48
-
49
-
50
-
51
-
52
-
53
-
54
-
55
-
56
-
57
-
58
-
59
-
60
-
61
-
62
-
63
-
64
-
65
-
66
-
67
-
68
-
69
-
70
-
71
-
72
-
73
-
74
-
75
-
76
-
77
-
78
-
79
-
80
-
81
-
82
-
83
-
84
-
85
-
86
-
87
-
88
-
89
-
90
-
91
-
92
-
93
-
94
-
95
-
96
-
97
-
98
-
99
-
100
 |
 |
