HP AM866A Brocade Troubleshooting and Diagnostics Guide v6.1.0 (53-1000853-01, - Page 108
Switch status, Viewing the overall status of the switch
 |
UPC - 884420064602
View all HP AM866A manuals
Add to My Manuals
Save this manual to your list of manuals |
Page 108 highlights
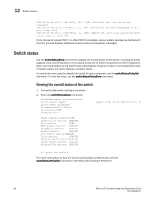
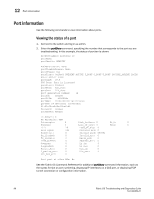
12 Switch status 2005/03/31-20:13:13, [BL-1001], 222,, INFO, Paulsa45, Port Initialization Completed 2005/03/31-20:13:13, [EM-5012], 0,, INFO, SW4100_P45, EM: sent dumpready to ME., em.c, line: 2152 2005/03/31-20:13:13, [DGD-5002], 0,, INFO, SW4100_P45, Slot 0 has passed the POST tests., main.c, line: 936 If you choose to bypass POST2, or after POST2 completes, various system services are started and the boot process displays additional console status and progress messages. Switch status Use the switchStatusShow command to display the overall status of the switch, including its power supplies, fans, and temperature. If the status of any one of these components is either marginal or down, the overall status of the switch is also displayed as marginal or down. If all components have a healthy status, the switch displays a healthy status. To modify the rules used to classify the health of each component use the switchStatusPolicySet command. To view the rules, use the switchStatusPolicyShow command. Viewing the overall status of the switch 1. Connect to the switch and log in as admin. 2. Enter the switchStatusShow command: brcdDCXbb:admin> switchstatsshow Switch Health Report Switch Name: brcdDCXbb IP address:192.32.234.63 SwitchState:DOWN Duration:00:37 Report time: 02/20/2008 06:02:51 PM Power supplies monitorDOWN Temperatures monitor HEALTHY Fans monitor DOWN WWN servers monitor HEALTHY Standby CP monitor HEALTHY Blades monitor HEALTHY Core Blades monitorHEALTHY Flash monitor HEALTHY Marginal ports monitorHEALTHY Faulty ports monitor HEALTHY Missing SFPs monitor HEALTHY All ports are healthy For more information on how the overall switch status is determined, see the switchStatusPolicySet command in the Fabric OS Command Reference. 94 Fabric OS Troubleshooting and Diagnostics Guide 53-1000853-01
-
 1
1 -
2
-
3
-
4
-
5
-
6
-
7
-
8
-
9
-
10
-
11
-
12
-
13
-
14
-
15
-
16
-
17
-
18
-
19
-
20
-
21
-
22
-
23
-
24
-
25
-
26
-
27
-
28
-
29
-
30
-
31
-
32
-
33
-
34
-
35
-
36
-
37
-
38
-
39
-
40
-
41
-
42
-
43
-
44
-
45
-
46
-
47
-
48
-
49
-
50
-
51
-
52
-
53
-
54
-
55
-
56
-
57
-
58
-
59
-
60
-
61
-
62
-
63
-
64
-
65
-
66
-
67
-
68
-
69
-
70
-
71
-
72
-
73
-
74
-
75
-
76
-
77
-
78
-
79
-
80
-
81
-
82
-
83
-
84
-
85
-
86
-
87
-
88
-
89
-
90
-
91
-
92
-
93
-
94
-
95
-
96
-
97
-
98
-
99
-
100
-
101
-
102
-
 103
103 -
 104
104 -
 105
105 -
 106
106 -
 107
107 -
 108
108 -
 109
109 -
 110
110 -
 111
111 -
 112
112 -
 113
113 -
114
-
115
-
116
-
117
-
118
-
119
-
120
-
121
-
122
-
123
-
124
-
125
-
126
-
127
-
128
-
129
-
130
-
131
-
132
 |
 |
