HP AM866A Brocade Troubleshooting and Diagnostics Guide v6.1.0 (53-1000853-01, - Page 109
Displaying switch information, Displaying the uptime for a switch
 |
UPC - 884420064602
View all HP AM866A manuals
Add to My Manuals
Save this manual to your list of manuals |
Page 109 highlights
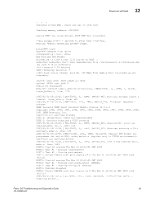
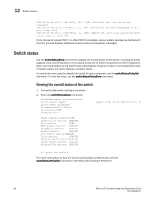
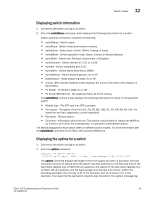
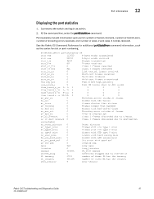
Switch status 12 Displaying switch information 1. Connect to the switch and log in as admin. 2. Enter the switchShow command, which displays the following information for a switch: Switch summary information includes the following: • switchName - Switch name. • switchType - Switch model and revision numbers. • switchState - Switch state: Online, Offline, Testing, or Faulty. • switchMode - Switch operation mode: Native, Interop, or Access Gateway. • switchRole - Switch role: Principal, Subordinate, or Disabled. • switchDomain - Switch domain ID: 0-31 or 1-239. • switchId - Switch embedded port D_ID. • switchWwn - Switch World Wide Name (WWN). • switchBeacon - Switch beaconing state: On or Off. • bladeBeacon - Blade beaconing state: On or Off. • zoning - When Access Gateway mode disabled, the name of the active zone displays in parenthesis. • FC Router - FC Router's state: On or Off. • FC Router BB Fabric ID - The backbone fabric ID for FC routing. The switchShow command also displays the following information for ports on the specified switch: • Module type - The SFP type if an SFP is present. • Port speed - The speed of the Port (1G, 2G, 4G, 8G, 10G, N1, N2, N4, N8, AN, UN). The speed can be fixed, negotiated, or auto-negotiated. • Port state - The port status. • Comment - Information about the port. This section may be blank or display the WWN for an F_Port or an E_Port, the trunking state, or upstream or downstream status. The details displayed for each switch differ on different switch models. For more information see the switchShow command in the Fabric OS Command Reference. Displaying the uptime for a switch 1. Connect to the switch and log in as admin. 2. Enter the uptime command: supp_dcx_184:admin> uptime 10:50:19 up 11 days, 6:28, 1 user, load average: 0.49, 0.53, 0.54 The uptime command displays the length of time the system has been in operation, the total cumulative amount of uptime since the system was first powered-on, the date and time of the last reboot (applies only to Fabric OS v3.x systems), the reason for the last reboot (applies only to Fabric OS v3.x systems), and the load average over the past one minute (1.29 in the preceding example), five minutes (1.31 in the example), and 15 minutes (1.27 in the example). The reason for the last switch reboot is also recorded in the system message log. Fabric OS Troubleshooting and Diagnostics Guide 95 53-1000853-01
-
 1
1 -
2
-
3
-
4
-
5
-
6
-
7
-
8
-
9
-
10
-
11
-
12
-
13
-
14
-
15
-
16
-
17
-
18
-
19
-
20
-
21
-
22
-
23
-
24
-
25
-
26
-
27
-
28
-
29
-
30
-
31
-
32
-
33
-
34
-
35
-
36
-
37
-
38
-
39
-
40
-
41
-
42
-
43
-
44
-
45
-
46
-
47
-
48
-
49
-
50
-
51
-
52
-
53
-
54
-
55
-
56
-
57
-
58
-
59
-
60
-
61
-
62
-
63
-
64
-
65
-
66
-
67
-
68
-
69
-
70
-
71
-
72
-
73
-
74
-
75
-
76
-
77
-
78
-
79
-
80
-
81
-
82
-
83
-
84
-
85
-
86
-
87
-
88
-
89
-
90
-
91
-
92
-
93
-
94
-
95
-
96
-
97
-
98
-
99
-
100
-
101
-
102
-
103
-
 104
104 -
 105
105 -
 106
106 -
 107
107 -
 108
108 -
 109
109 -
 110
110 -
 111
111 -
 112
112 -
 113
113 -
 114
114 -
115
-
116
-
117
-
118
-
119
-
120
-
121
-
122
-
123
-
124
-
125
-
126
-
127
-
128
-
129
-
130
-
131
-
132
 |
 |