Kyocera ECOSYS FS-4100DN PRESCRIBE Commands Technical Reference Manual - Rev. - Page 36
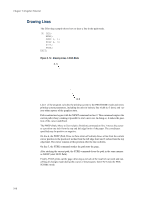
Drawing Pie Charts
 |
View all Kyocera ECOSYS FS-4100DN manuals
Add to My Manuals
Save this manual to your list of manuals |
Page 36 highlights
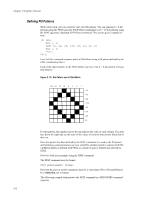
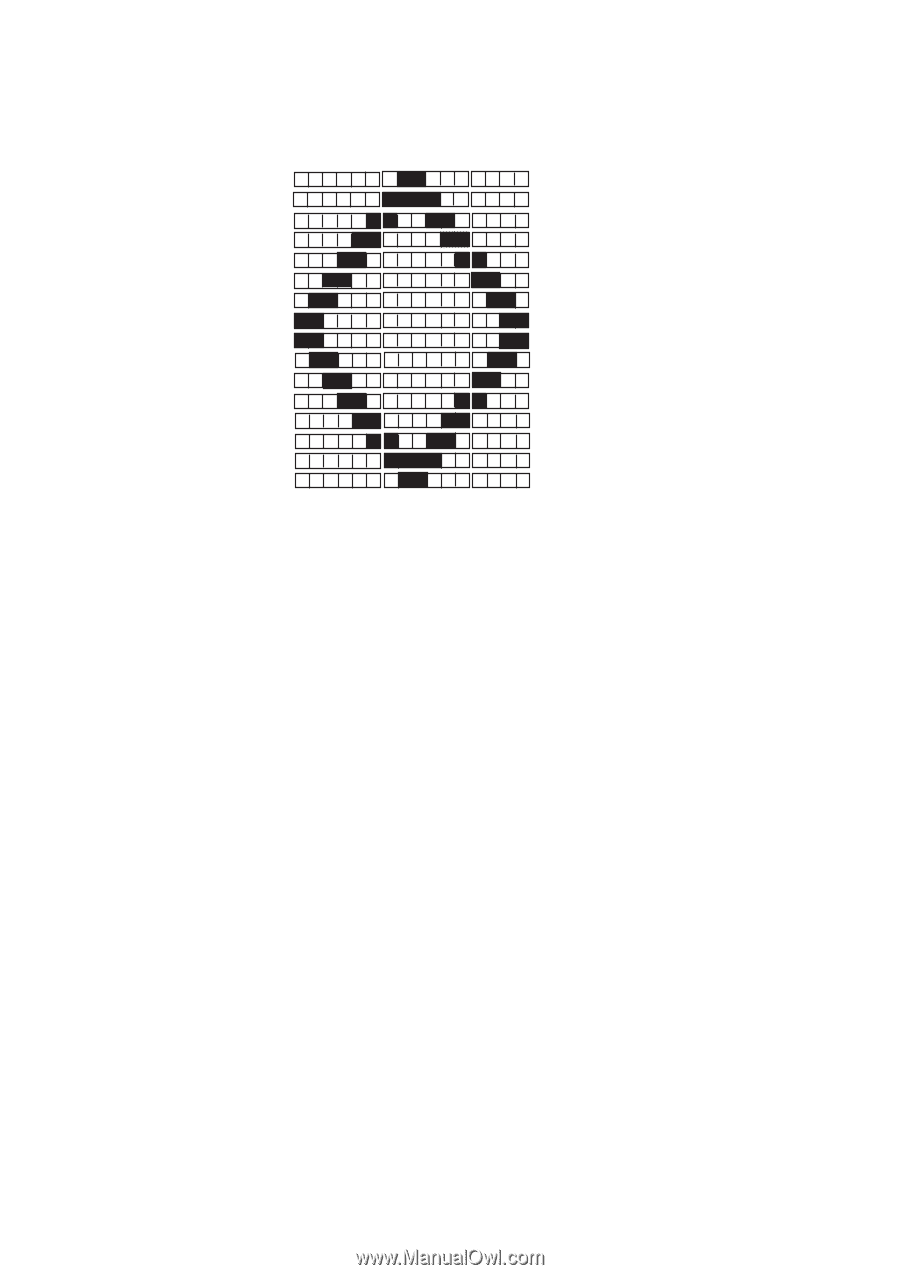
Chapter 2 Graphics Tutorial Column value 0+64=64 (@) 24+64=88 (X) 0+48=48 (0) 0+64=64 (@) 60+64=124 (|) 0+48=48 (0) 1+64=65 (A) 38+64=102 (f) 0+48=48 (0) 3+64=67 (C) 3+64=67 (C) 0+48=48 (0) 6+64=70 (F) 1+64=65 (A) 8+48=56 (8) 12+64=76 (L) 0+64=64 (@) 12+48=60 (
-
 1
1 -
2
-
3
-
4
-
5
-
6
-
7
-
8
-
9
-
10
-
11
-
12
-
13
-
14
-
15
-
16
-
17
-
18
-
19
-
20
-
21
-
22
-
23
-
24
-
25
-
26
-
27
-
28
-
29
-
30
-
 31
31 -
 32
32 -
 33
33 -
 34
34 -
 35
35 -
 36
36 -
 37
37 -
 38
38 -
 39
39 -
 40
40 -
 41
41 -
42
-
43
-
44
-
45
-
46
-
47
-
48
-
49
-
50
-
51
-
52
-
53
-
54
-
55
-
56
-
57
-
58
-
59
-
60
-
61
-
62
-
63
-
64
-
65
-
66
-
67
-
68
-
69
-
70
-
71
-
72
-
73
-
74
-
75
-
76
-
77
-
78
-
79
-
80
-
81
-
82
-
83
-
84
-
85
-
86
-
87
-
88
-
89
-
90
-
91
-
92
-
93
-
94
-
95
-
96
-
97
-
98
-
99
-
100
-
101
-
102
-
103
-
104
-
105
-
106
-
107
-
108
-
109
-
110
-
111
-
112
-
113
-
114
-
115
-
116
-
117
-
118
-
119
-
120
-
121
-
122
-
123
-
124
-
125
-
126
-
127
-
128
-
129
-
130
-
131
-
132
-
133
-
134
-
135
-
136
-
137
-
138
-
139
-
140
-
141
-
142
-
143
-
144
-
145
-
146
-
147
-
148
-
149
-
150
-
151
-
152
-
153
-
154
-
155
-
156
-
157
-
158
-
159
-
160
-
161
-
162
-
163
-
164
-
165
-
166
-
167
-
168
-
169
-
170
-
171
-
172
-
173
-
174
-
175
-
176
-
177
-
178
-
179
-
180
-
181
-
182
-
183
-
184
-
185
-
186
-
187
-
188
-
189
-
190
-
191
-
192
-
193
-
194
-
195
-
196
-
197
-
198
-
199
-
200
-
201
-
202
-
203
-
204
-
205
-
206
-
207
-
208
-
209
-
210
-
211
-
212
-
213
-
214
-
215
-
216
-
217
-
218
-
219
-
220
-
221
-
222
-
223
-
224
-
225
-
226
-
227
-
228
-
229
-
230
-
231
-
232
-
233
-
234
-
235
-
236
-
237
-
238
-
239
-
240
-
241
-
242
-
243
-
244
-
245
-
246
-
247
-
248
-
249
-
250
-
251
-
252
-
253
-
254
-
255
-
256
-
257
-
258
-
259
-
260
 |
 |
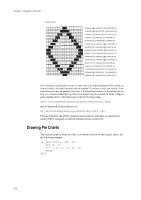
Chapter 2 Graphics Tutorial
2-14
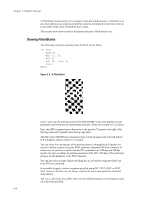
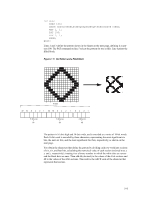
If the character resulting for section
x
of any row is @ (indicating that all bits in that sec-
tion are white), then that character may be omitted. If sections
x
and
y
are both @, then
both characters may be omitted. However, if the result for section
y
is @ and that for sec-
tion
x
is a character other than @, then no characters may be omitted. In terms of the pro-
gram example above, what this means is that the bit map string,
@X0@|0Af0CC0FA8L@<X@6p@3p@3X@6L@<FA8CC0Af0@|0@X0;
may be shortened by four characters to:
X0|0Af0CC0FA8L@<X@6p@3p@3X@6L@<FA8CC0Af0|0X0;
Patterns defined by the XPAT command remain effective until they are redefined by
another XPAT command, or until the printing system is turned off.
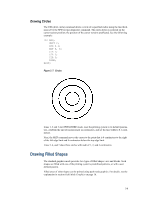
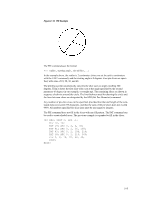
Drawing Pie Charts
The standard graphics mode provides a convenient function for drawing pie charts. See
the following example:
!R! RES; UNIT C; SPD .05;
MZP 10, 10;
PIE 2, 0, 10, 20, 30, 40;
PAGE;
EXIT;
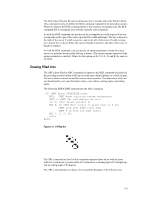
Column value
0+64=64 (@) 24+64=88 (X) 0+48=48 (0)
0+64=64 (@) 60+64=124 (|) 0+48=48 (0)
1+64=65 (A) 38+64=102 (f) 0+48=48 (0)
3+64=67 (C) 3+64=67 (C) 0+48=48 (0)
6+64=70 (F) 1+64=65 (A) 8+48=56 (8)
12+64=76 (L) 0+64=64 (@) 12+48=60 (<)
24+64=88 (X) 0+64=64 (@) 6+48=54 (6)
48+64=112 (p) 0+64=64 (@) 3+48=51 (3)
48+64=112 (p) 0+64=64 (@) 3+48=51 (3)
24+64=88 (X) 0+64=64 (@) 6+48=54 (6)
12+64=76 (L) 0+64=64 (@) 12+48=60 (<)
6+64=70 (F) 1+64=65 (A) 8+48=56 (8)
3+64=67 (C) 3+64=67 (C) 0+48=48 (0)
1+64=65 (A) 38+64=102 (f) 0+48=48 (0)
0+64=64 (@) 60+64=124 (|) 0+48=48 (0)
0+64=64 (@) 24+64=88 (X) 0+48=48 (0)