Pioneer AVIC-X930BT Owner's Manual - Page 32
Checking the eco-friendly, driving status, Eco-friendly driving functions - gauge display
 |
UPC - 884938127097
View all Pioneer AVIC-X930BT manuals
Add to My Manuals
Save this manual to your list of manuals |
Page 32 highlights
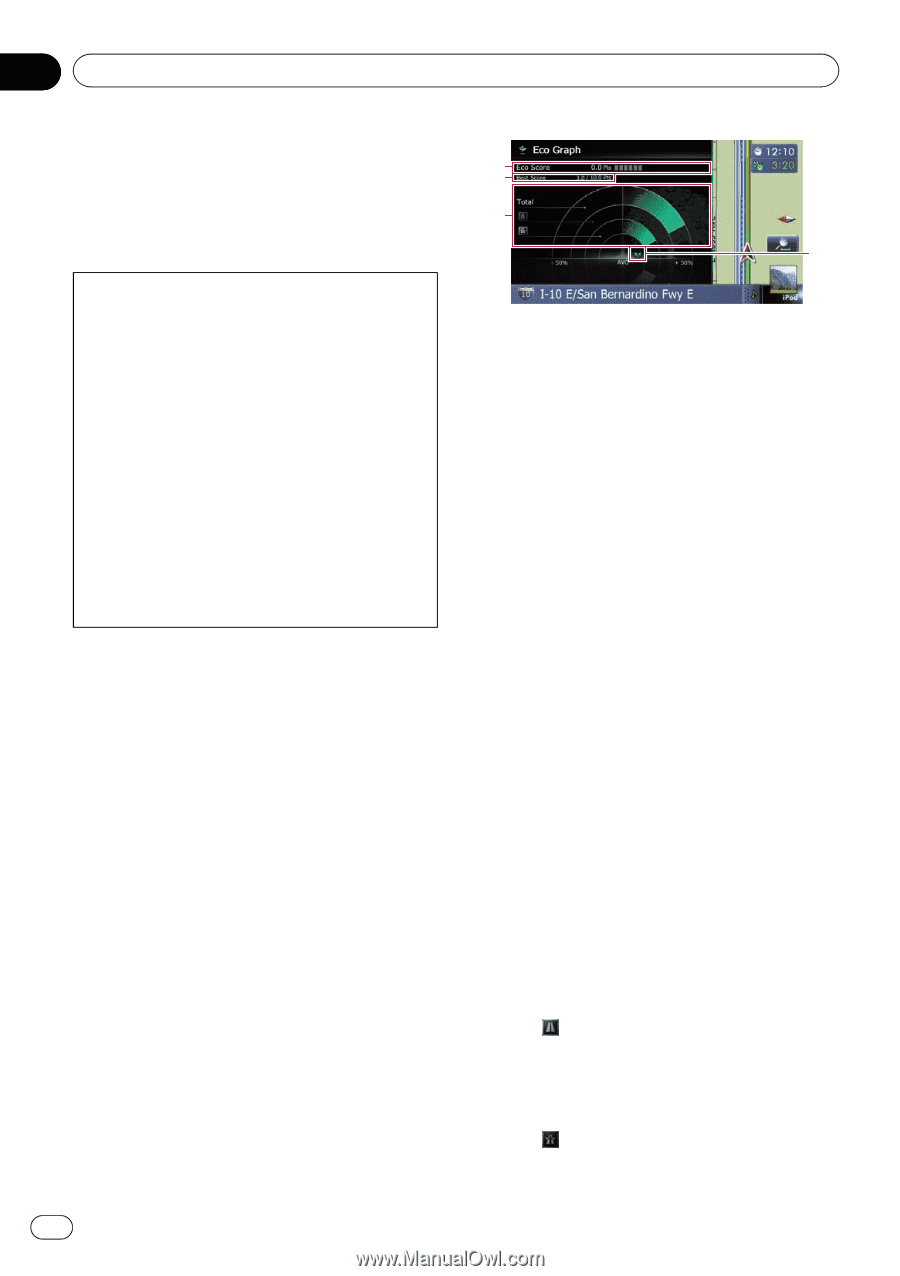
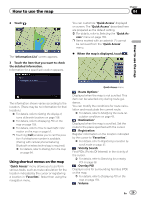
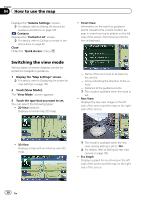
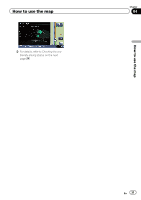
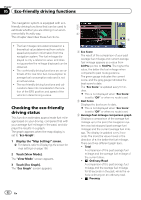
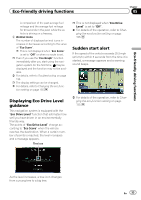
Chapter 05 Eco-friendly driving functions This navigation system is equipped with ecofriendly driving functions that can be used to estimate whether you are driving in an environmentally friendly way. This chapter describes these functions. ! The fuel mileage calculated is based on a theoretical value determined from vehicle speed and position information from the navigation system. The fuel mileage displayed is only a reference value, and does not guarantee the mileage displayed can be obtained. ! The eco-friendly driving functions are an estimate of the real time fuel consumption to average fuel consumption ratio and is not an actual value. ! The eco-friendly driving functions and calculations take into consideration the location of the GPS position and speed of the vehicle in determining a value. Checking the eco-friendly driving status This function estimates approximate fuel mileage based on your driving, compares that with your average fuel mileage in the past, and displays the results in a graph. The graph appears when the map display is set to "Eco Graph". 1 Display the "Map Settings" screen. = For details, refer to Displaying the screen for map settings on page 156. 2 Touch [View Mode]. The "View Mode" screen appears. 3 Touch [Eco Graph]. The "Eco Graph" screen appears. 1 2 3 4 1 Eco Score The result of the comparison of your past average fuel mileage and current average fuel mileage appears as a value from 0.0 Pts (points) to 10.0 Pts. The higher the value, the better the fuel mileage when compared to past route guidance. The green gauge indicates the current score, and the gray gauge indicates the best score to date. The "Eco Score" is updated every 5 minutes. p This is not displayed when "Eco Score" is set to "Off" or when no route is set. 2 Best Score Displays the best score to date. p This is not displayed when "Eco Score" is set to "Off" or when no route is set. 3 Average fuel mileage comparison graph Displays a comparison of the average fuel mileage up to the point the navigation system was last stopped (past average fuel mileage) and the current average fuel mileage. The display is updated every 3 seconds. The more the value moves in the direction of +, the better the fuel mileage. There are three different graph bars. ! Total A comparison of the past average fuel mileage and the average fuel mileage of the current drive. ! : Ordinary Road A comparison of the past average fuel mileage and the average fuel mileage for 90 seconds in the past, while the vehicle is driving on an ordinary road. ! : Freeway 32 En
-
 1
1 -
2
-
3
-
4
-
5
-
6
-
7
-
8
-
9
-
10
-
11
-
12
-
13
-
14
-
15
-
16
-
17
-
18
-
19
-
20
-
21
-
22
-
23
-
24
-
25
-
26
-
 27
27 -
 28
28 -
 29
29 -
 30
30 -
 31
31 -
 32
32 -
 33
33 -
 34
34 -
 35
35 -
 36
36 -
 37
37 -
38
-
39
-
40
-
41
-
42
-
43
-
44
-
45
-
46
-
47
-
48
-
49
-
50
-
51
-
52
-
53
-
54
-
55
-
56
-
57
-
58
-
59
-
60
-
61
-
62
-
63
-
64
-
65
-
66
-
67
-
68
-
69
-
70
-
71
-
72
-
73
-
74
-
75
-
76
-
77
-
78
-
79
-
80
-
81
-
82
-
83
-
84
-
85
-
86
-
87
-
88
-
89
-
90
-
91
-
92
-
93
-
94
-
95
-
96
-
97
-
98
-
99
-
100
-
101
-
102
-
103
-
104
-
105
-
106
-
107
-
108
-
109
-
110
-
111
-
112
-
113
-
114
-
115
-
116
-
117
-
118
-
119
-
120
-
121
-
122
-
123
-
124
-
125
-
126
-
127
-
128
-
129
-
130
-
131
-
132
-
133
-
134
-
135
-
136
-
137
-
138
-
139
-
140
-
141
-
142
-
143
-
144
-
145
-
146
-
147
-
148
-
149
-
150
-
151
-
152
-
153
-
154
-
155
-
156
-
157
-
158
-
159
-
160
-
161
-
162
-
163
-
164
-
165
-
166
-
167
-
168
-
169
-
170
-
171
-
172
-
173
-
174
-
175
-
176
-
177
-
178
-
179
-
180
-
181
-
182
-
183
-
184
-
185
-
186
-
187
-
188
-
189
-
190
-
191
-
192
-
193
-
194
-
195
-
196
-
197
-
198
-
199
-
200
-
201
-
202
-
203
-
204
-
205
-
206
-
207
-
208
-
209
-
210
-
211
-
212
-
213
-
214
-
215
-
216
-
217
-
218
-
219
-
220
-
221
-
222
-
223
-
224
-
225
-
226
-
227
-
228
-
229
-
230
-
231
-
232
 |
 |