Texas Instruments TINSPIRE Data Collection Guidebook
Texas Instruments TINSPIRE Manual
 |
View all Texas Instruments TINSPIRE manuals
Add to My Manuals
Save this manual to your list of manuals |
Texas Instruments TINSPIRE manual content summary:
- Texas Instruments TINSPIRE | Data Collection Guidebook - Page 1
TI-Nspire™ Data Collection and Analysis Guidebook This guidebook applies to TI-Nspire™ software version 3.1. To obtain the latest version of the documentation, go to education.ti.com/guides. - Texas Instruments TINSPIRE | Data Collection Guidebook - Page 2
as-is" basis. In no event shall Texas Instruments be liable to anyone for special, collateral, . These limits are designed to provide reasonable protection against harmful interference in a residential installation. and used in accordance with the instructions, may cause harmful interference to - Texas Instruments TINSPIRE | Data Collection Guidebook - Page 3
Name 42 Adding a New Column 43 Adding a New Calculated Column 45 Striking and Restoring Data 47 Analyzing Data in Graph View 51 Viewing Data for Analysis 51 Interpolating the Value for Triggering 65 Using the Manual Trigger to Start the Collection 67 Using a Delay to Start the Collection 68 - Texas Instruments TINSPIRE | Data Collection Guidebook - Page 4
92 Viewing Data Collection Status 94 Managing Power 95 Charging the Lab Cradle 97 Upgrading the Operating System 98 Appendix: Service and Support 103 Texas Instruments Support and Service 103 Service and Warranty Information 103 Precautions for Rechargeable Batteries 104 Index 105 iv - Texas Instruments TINSPIRE | Data Collection Guidebook - Page 5
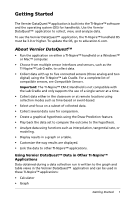
data. To use the Vernier DataQuest™ application, the TI-Nspire™ handheld OS must be 3.0 or higher. To update the OS, go to education.ti.com. About Vernier DataQuest™ • Run the application on either a TI-Nspire™ handheld or a Windows™ or Mac™ computer. • Choose from multiple sensor interfaces and - Texas Instruments TINSPIRE | Data Collection Guidebook - Page 6
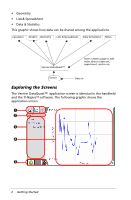
• Data & Statistics This graphic shows how data can be shared among the applications. Calculator Graphs Geometry Lists & Spreadsheet Data The Vernier DataQuest™ application screen is identical in the handheld and the TI-Nspire™ software. The following graphic shows the application screen. À Á - Texas Instruments TINSPIRE | Data Collection Guidebook - Page 7
points. Learning About Menus Like other TI-Nspire™ applications, the Vernier DataQuest™ application has its own application and context menus. When you first open a document or problem, insert the Vernier DataQuest™ application to open the application menu. Click Insert > Vernier DataQuest. The - Texas Instruments TINSPIRE | Data Collection Guidebook - Page 8
In the TI-Nspire™ Teacher Software, click these tabs to switch from the Content Workspace to the Documents Workspace. These tabs are not shown in the student software. Á Toolbar. Contains shortcuts to tools used to create folders, save files, create lesson bundles, send files to handhelds, and copy - Texas Instruments TINSPIRE | Data Collection Guidebook - Page 9
change General or Graphs & Geometry settings. Â Handheld: Lets you view documents as they appear on a handheld screen. The screen size is limited as it would be on the handheld. Click to activate the handheld view. Ã Computer: Lets you view documents as they appear in the software. Computer is the - Texas Instruments TINSPIRE | Data Collection Guidebook - Page 10
Texas Instruments TI-Nspire™ Lab Cradle This sensor is used with handhelds, computers, or as a stand-alone sensor. This sensor interface allows you to connect and use one to five sensors at the same time. It can be used in the lab or at a remote collection location. The Lab Cradle supports - Texas Instruments TINSPIRE | Data Collection Guidebook - Page 11
you can use with a handheld. Sensor Texas Instruments CBR 2™ Description This analog sensor connects directly to TI-Nspire™ handhelds through the mini-USB port. It is used to explore and graph motion. This sensor automatically launches the Vernier DataQuest™ application when you connect it to - Texas Instruments TINSPIRE | Data Collection Guidebook - Page 12
connects directly to TI-Nspire™ handhelds through the mini-USB port and is used to collect temperature ranges. You can design experiments to: • Collect weather data. • Record temperature changes due to chemical reactions. • Perform heat fusion studies. Sensors for Computers The following table - Texas Instruments TINSPIRE | Data Collection Guidebook - Page 13
problem. Important! If you connect a sensor before starting the Vernier DataQuest™ application, the software automatically opens the Vernier DataQuest™ application Document To start a new document: 1. Click File > New TI-Nspire Document. Handheld: Press c, and then select New Document. A new document - Texas Instruments TINSPIRE | Data Collection Guidebook - Page 14
-USB, USB, or BT connector and the appropriate cable. 2. Attach the interface to a computer or handheld using the appropriate connector and cable. Note: To attach a handheld to a TI-Nspire™ Lab Cradle, slide the handheld into the connector at the bottom of the Lab Cradle. Direct-connect USB sensors - Texas Instruments TINSPIRE | Data Collection Guidebook - Page 15
. The collected data reflects the new measurement unit. Calibrating a Sensor When the software or handheld detects a sensor, the calibration for that sensor automatically loads. You can calibrate some sensors manually. Other sensors, such as the Colorimeter and the Dissolved Oxygen Sensor, must be - Texas Instruments TINSPIRE | Data Collection Guidebook - Page 16
To set the standing value to zero: 1. Click Experiment > Set Up Sensor. 2. Click the sensor, and then click Zero. Note: The sensors displayed in the sensor list are those attached or selected to use offline. The sensor value is now at zero. Reversing a Sensor Reading Display Use this feature to - Texas Instruments TINSPIRE | Data Collection Guidebook - Page 17
The Time Based collection mode captures data using timing as a guide. Set this mode to collect either samples per second (Rate seconds per sample. The rate is calculated. 3. Type the number of seconds the data collection should last in the Duration field. 4. Review the value in the Number of points - Texas Instruments TINSPIRE | Data Collection Guidebook - Page 18
The settings are saved for the next run. Setting the Events with Entry Collection Mode Use the Events with Entry collection to capture samples manually by defining the independent value for each point you collect. To set the collection mode as Events with Entry: 1. Click Experiment > Collection Mode - Texas Instruments TINSPIRE | Data Collection Guidebook - Page 19
controls. now appears (inactive) in Data Setting the Selected Events Collection Mode Use the Selected Event collection mode to capture samples manually by defining the independent value for each point you collect. To set the collection mode as Selected Events: 1. Select Experiment > Collection - Texas Instruments TINSPIRE | Data Collection Guidebook - Page 20
steps required for collecting data. If you are in Meter View when you start data collection, the Vernier DataQuest™ application changes to Graph View and begins recording sensor data. The graph updates to show the data as it is collected. Important: When you use either Events with Entry mode or the - Texas Instruments TINSPIRE | Data Collection Guidebook - Page 21
data collection for any other mode manually at any time. To stop a collection: Click Experiment > Stop Collection. The current run stops. Collecting Data in the Time Based Mode To collect data using the Time Based mode: 1. Click Experiment > New Experiment to reset the sensor to its default values - Texas Instruments TINSPIRE | Data Collection Guidebook - Page 22
data point is saved in the appropriate location on the graph. The next point appears in the center of the graph. 8. Repeat steps four, five, and six until you Average over 10 s option: 1. Click Experiment > New Experiment to reset the sensor to its default values. This step removes any existing data - Texas Instruments TINSPIRE | Data Collection Guidebook - Page 23
zero, the system records the data point in the appropriate location on the graph. 6. Repeat steps four and five until you collect all of the data the Selected Events collection mode: 1. Click Experiment > New Experiment to reset the sensor to its default values. This step removes any existing data - Texas Instruments TINSPIRE | Data Collection Guidebook - Page 24
Data in the Drop Counting Mode Use this procedure only after you assign Drop Counting as the collection mode. 1. Click Experiment > New Experiment to reset the sensor to its default values. This step removes any existing data and ensures the connected sensor is set to its default values. 2. Connect - Texas Instruments TINSPIRE | Data Collection Guidebook - Page 25
experiment, save it as a TI-Nspire™ document (.tns file) or as a TI-Nspire™ PublishView™ document (.tnsp). Important: The PublishView™ application is only available in the computer software. 1. Select the document you want to save. 2. Select File > Save Document. Handheld: Press ~, and then click - Texas Instruments TINSPIRE | Data Collection Guidebook - Page 26
22 Performing an Experiment - Texas Instruments TINSPIRE | Data Collection Guidebook - Page 27
that plots more than one column of data. • Multiple sensors with different defined units at the same time. You can display the top graph (Graph1), bottom graph (Graph 2), or both. In this example, two sensors (the Gas Pressure sensor and the Hand Dynamometer) were used in the same run. The following - Texas Instruments TINSPIRE | Data Collection Guidebook - Page 28
Graph When two graphs are displayed, the top graph is Graph 1 and the bottom graph is Graph 2. To display only Graph 1: Select Graph > Show Graph > Graph 1. Only Graph1 is displayed. To display only Graph 2: Select Graph > Show Graph > Graph 2. Only Graph 2 is displayed. 24 Working in the Graph - Texas Instruments TINSPIRE | Data Collection Guidebook - Page 29
both Graph 1 and Graph 2 together: Select Graph > Show Graph > Both. Graph1 and Graph 2 are displayed. Displaying Graphs in the Page Layout View Use the Page layout view when Show Graph is not the appropriate solution for showing more than one graph. The Show Graph option is not applicable when - Texas Instruments TINSPIRE | Data Collection Guidebook - Page 30
page symbol was selected. 4. Select "Click here to add an application." Handheld: Press b. 5. Select Add Vernier DataQuest. The Vernier DataQuest™ application is added to the second view. This example shows two Vernier DataQuest™ applications running at the same time. 26 Working in the Graph View - Texas Instruments TINSPIRE | Data Collection Guidebook - Page 31
view is displayed. Note: Selection in one view is reflected in the other. 7. To show the same view, click the view to change. 8. Click View > Graph. The new view is displayed. Working in the - Texas Instruments TINSPIRE | Data Collection Guidebook - Page 32
the axis. Adding a Title When you add a title to a graph, the title is displayed in the View Details area. When you print the graph, the title prints on the graph. 1. Click Graph > Graph Title. The Graph Title dialog box opens. If there are two graphs in the work area, the dialog box has two title - Texas Instruments TINSPIRE | Data Collection Guidebook - Page 33
in the Title field. -or- a) Type the name of the first graph in the Graph 1 field. b) Type the name of the second graph in the Graph 2 field. 3. Select Enable to show the title. Note: Use the Enable option to hide or show the graph title as needed. 4. Click OK. The title is shown. Setting Axis - Texas Instruments TINSPIRE | Data Collection Guidebook - Page 34
of these fields: - X Min - X Max - Y Min - Y Max 3. Click OK. The application uses the new values for the graph visual range until you modify the range or change data sets. Setting Axis Ranges for Two Graphs When working with two graphs, enter two y axis minimum and maximum values, but only one set - Texas Instruments TINSPIRE | Data Collection Guidebook - Page 35
You can modify the minimum and maximum range for the x and y axis on the graph. 1. Select the text you want to change. 2. Type a new value for the text. Handheld: a) Place the cursor over the value until the cursor changes to an I-beam . b) Highlight the text you want to change. c) Type a new value - Texas Instruments TINSPIRE | Data Collection Guidebook - Page 36
a Data Set to Plot To save data sets or run multiple trials, select the data set to plot. 1. Click Graph > Select Data Set. The list of available data sets opens. 2. Select one of the following: • Data Set name Custom. 3. Click OK. The data set you selected is displayed. 32 Working in the Graph View - Texas Instruments TINSPIRE | Data Collection Guidebook - Page 37
change the x and y axis range or zoom in or out of a graph. You can also define the automatic autoscale setting to use during and after a collection. Autoscale Now Using the Application Menu Click Graph > Autoscale Now. The graph now displays all the points plotted. Autoscale Now Using the Context - Texas Instruments TINSPIRE | Data Collection Guidebook - Page 38
To select a range: 1. Place the cursor at the start of the area. 2. Drag the cursor across the graph to the end of the selected region. The selected area is indicated by gray shading. Handheld: a) Place the cursor at the starting point, and then press / x. The cursor changes to (double-headed arrow - Texas Instruments TINSPIRE | Data Collection Guidebook - Page 39
view and zoom in performed multiple times (or as a selected region). Zooming Out of a Graph To zoom out of a graph: Select Graph > Zoom Out. The graph is now expanded. If a zoom in preceded a zoom out, the graph displays the settings prior to the zoom in. For example, if you zoomed in twice, the - Texas Instruments TINSPIRE | Data Collection Guidebook - Page 40
point markers. Setting Point Options To indicate how often marks show on the graph and whether to use a connecting line: 1. Click Options > Point Options. Connect Data Points to remove the line between points. The following graphics show examples of some of the point Mark options. Regional Connect - Texas Instruments TINSPIRE | Data Collection Guidebook - Page 41
Changing Point Colors To change the color of the marks from the default settings. Note: On a TI-Nspire™ handheld, color is represented by different shades of gray. 1. Right-click the graph to open the menu. 2. Click Color. Note: The data option is often preceded by the data set name and column name. - Texas Instruments TINSPIRE | Data Collection Guidebook - Page 42
Selecting Point Markers 1. Right-click in the graph to open the menu. 2. Click Point Marker. Note: If there is only one dependent variable column, the Point Marker option selected. In this example, Pressure was selected and the inverted fill triangle was the point chosen. 38 Working in the Graph View - Texas Instruments TINSPIRE | Data Collection Guidebook - Page 43
number of data sets. • More. Selecting More opens the Select dialog box. Use this when you want to select a combination of data set variables to graph. Showing and Hiding Details You can hide parts of the screen to provide a larger view of the screen. The following example shows screens with the - Texas Instruments TINSPIRE | Data Collection Guidebook - Page 44
Options > Hide Details. The menu changes from Hide Details to Show Details. The following parts of the screen are hidden: • Vernier DataQuest™ application view tabs • View Details area • Data collection controls The following example shows screens with the details hidden. To show details: Click - Texas Instruments TINSPIRE | Data Collection Guidebook - Page 45
run and the Vernier Gas Pressure Sensor is attached. 2. Click Data > Column Options. The Column Options menu opens. Note: You can be in the Meter, Graph, or Table view and still click these menu options. The results will still be visible. 3. Click the name of the column you want to define - Texas Instruments TINSPIRE | Data Collection Guidebook - Page 46
. Note: The default precision is related to the precision of the sensor. 8. Select Link to list to link to the symbol table and make this information available to other TI-Nspire™ applications. Note: Linking is the default for most sensors. Important: Heart rate and blood pressure sensors require - Texas Instruments TINSPIRE | Data Collection Guidebook - Page 47
Click OK. The data set name is now changed. Table View Graph View Adding a New Column To enter data manually, add a new column. Sensor columns cannot be modified, but data entered manually can be edited. 1. Click Data > New Manual Column. The Column Options dialog box opens. Analyzing the Data in - Texas Instruments TINSPIRE | Data Collection Guidebook - Page 48
the Start field. b) Type an ending value in the End field. c) Type the increase in value in the Increment field. The number of points is calculated and shown in the Number of Points field. 8. Select Link from list to link to data in another TI-Nspire™ application. 44 Analyzing the Data in Table View - Texas Instruments TINSPIRE | Data Collection Guidebook - Page 49
application and includes a column label. 9. Select Link to list to link to the symbol table and make this information available to other TI-Nspire™ applications. Note: Linking the values are calculated from an expression using at least one of the existing columns. Use a calculated column when finding - Texas Instruments TINSPIRE | Data Collection Guidebook - Page 50
precision is related to the precision of the sensor. 6. Type a calculation including one of the column names in the Expression field. Note: .") 7. Select Link to list to link to the symbol table and make this information available to other TI-Nspire™ applications. Note: Linking is the default - Texas Instruments TINSPIRE | Data Collection Guidebook - Page 51
8. Click OK. The new calculated column is created. Striking and Restoring Data To strike data: 1. Open the data run that contains the data to be struck. 2. Select View > Table. 3. Select - Texas Instruments TINSPIRE | Data Collection Guidebook - Page 52
to select the rest of the region. Click the Touchpad to complete the selection. In this example, row 21 is selected as the beginning area and row 147 as the end. Beginning of selection End of selection. 4. Click Data > Strike Data. Handheld: Press b, and then click Data > Strike Data. 5. Select one - Texas Instruments TINSPIRE | Data Collection Guidebook - Page 53
• All Data - Restore all data. No data selection necessary. The data is restored. Analyzing the Data in Table View 49 - Texas Instruments TINSPIRE | Data Collection Guidebook - Page 54
50 Analyzing the Data in Table View - Texas Instruments TINSPIRE | Data Collection Guidebook - Page 55
View In the Vernier DataQuest™ application, use Graph View to analyze data. Start by setting up graphs, and then using analysis tools such as integral, statistics, and curve fit to investigate the mathematical nature of the data. Important: The Graph menu and Analyze menu items are only available - Texas Instruments TINSPIRE | Data Collection Guidebook - Page 56
of the details. Expanding the View Details Area Use this procedure to expand the View Detail area. Increasing its size reduces the size of the graph. Use this same procedure to reduce the View Details area. In this example, tangent line and statistics are displayed. 1. Place the cursor at the edge - Texas Instruments TINSPIRE | Data Collection Guidebook - Page 57
line moves between and beyond data points. To use Interpolate: 1. Click Analyze > Interpolate. A check mark appears in the menu next to the option. 2. Click the graph. The examine indicator is drawn to the nearest data point. The values of the plotted data are shown in the View details area and the - Texas Instruments TINSPIRE | Data Collection Guidebook - Page 58
. You can find the area under all of the data or a selected region of the data. To find the area under a data plot: 1. Leave the graph unselected to examine all the data, or select a range to examine a specific area. 2. Click Analyze > Integral. 3. Select the plotted column name if you have more - Texas Instruments TINSPIRE | Data Collection Guidebook - Page 59
of samples are calculated. You can find graph unselected to examine all the data, or select a range to examine a specific area. 2. Click Analyze > Statistics. 3. Select the plotted column name if you have more than a single column. For example, run1.Pressure. The Stats dialog box opens. 4. Review - Texas Instruments TINSPIRE | Data Collection Guidebook - Page 60
(d 0) Natural Exponential Proportional Calculated in the form: y = m*x + b y = a*x^2 + b*x + c y = a*x^3 + b*x^2 + c*x + d y = a*x^4 + b*x^3 + c*x^2 + d*x + e y = a*x^b y = a*b^x y = a + b*ln(x) y = a*sin(b*x + c) + d y = c/(1 + a*e^(-bx)) + d y = a*e^(-c*x) y = a*x 56 Analyzing Data in Graph View - Texas Instruments TINSPIRE | Data Collection Guidebook - Page 61
The Fit Linear dialog box opens. 4. Click OK. The following image is an example of a Quadratic curve fit. 5. Review the data. For information on clearing the Curve Fit analysis, see Removing Analysis Options. Analyzing Data in Graph View 57 - Texas Instruments TINSPIRE | Data Collection Guidebook - Page 62
Plotting a Model This option provides a manual method for plotting a function to fit data. Use one of the predefined models or enter your own. You can also set - Click to select a value from the drop-down list. 3. Click OK. The Set Coefficient Values dialog box opens. 58 Analyzing Data in Graph View - Texas Instruments TINSPIRE | Data Collection Guidebook - Page 63
values. You can also adjust these values in the View Details area. The model is shown on the graph with adjustment options in the View Details area and in the All Details for Graph dialog box. Notice that the minimum and maximum axis are too large for this particular example. Spin buttons - Texas Instruments TINSPIRE | Data Collection Guidebook - Page 64
adjustments to the coefficients. -or- Click the value in the View Details area. This graphic is an example of a model with adjusted values. Removing Analysis Options When clearing previously analyzed data from the graph and the View Details area, you can choose to clear all data, a specific data - Texas Instruments TINSPIRE | Data Collection Guidebook - Page 65
• Statistics • Curve Fit • Model 1. Click Analyze > Remove. 2. Select the data display you want to remove. The display you selected is removed from the graph and the View Details area. Analyzing Data in Graph View 61 - Texas Instruments TINSPIRE | Data Collection Guidebook - Page 66
62 Analyzing Data in Graph View - Texas Instruments TINSPIRE | Data Collection Guidebook - Page 67
the TI-Nspire™ Lab Cradle or a sensor with a trigger to start the collection. • A time delay to start the collection. Setting Up Offline Sensors Use the Add Offline Sensor option to set collection parameters and change units for a sensor that is not currently attached to a computer or handheld. You - Texas Instruments TINSPIRE | Data Collection Guidebook - Page 68
Setting Up a Remote Collection Unit Only the TI-Nspire™ Lab Cradle, TI CBR 2™, and Vernier Go!Motion® support remote data collection. Sensors use values currently defined in the Vernier DataQuest™ application. You must edit these collection mode values before you set up the remote unit. For more - Texas Instruments TINSPIRE | Data Collection Guidebook - Page 69
the Lab Cradle to start the collection. See Using the Manual Trigger to Start the Collection. 6. Click OK. The the Sensor for Triggering To start data collection based on a specific sensor reading, the TI-Nspire™ Lab Cradle and sensor must be connected. You must set the sensor and the threshold - Texas Instruments TINSPIRE | Data Collection Guidebook - Page 70
trigger dropdown list. Note: The menu displays the sensors connected to the TI-Nspire™ Lab Cradle. 4. Select one of the following from the Select the you change the unit type after setting the threshold, the value automatically updates. For example, if you use the Vernier Gas Pressure sensor with the - Texas Instruments TINSPIRE | Data Collection Guidebook - Page 71
active. Using the Manual Trigger to Start the Collection 1. Save and close any open documents. When performing experiments, TI recommends that you application is set to its default values. 3. Attach a sensor to the TI-Nspire™ Lab Cradle. 4. Attach the TI-Nspire™ Lab Cradle to the computer or handheld - Texas Instruments TINSPIRE | Data Collection Guidebook - Page 72
the manual trigger button on the Lab Cradle to start data collection. 8. Click OK. The Remote Setup dialog box opens indicating the sensor is ready for remote collection. 9. Disconnect the Lab Cradle. 10. Click OK. When you disconnect the TI-Nspire™ Lab Cradle from the handheld or computer, verify - Texas Instruments TINSPIRE | Data Collection Guidebook - Page 73
™ application is set to its default values. 3. Attach a sensor to the TI-Nspire™ Lab Cradle. 4. Attach the TI-Nspire™ Lab Cradle to the computer or handheld. 5. Click Experiment > Advanced Set Up > Remote Collection > TI-Nspire Lab Cradle. The Remote Setup Details dialog box opens. 6. Review the - Texas Instruments TINSPIRE | Data Collection Guidebook - Page 74
transfers, you can analyze the data. For more information, see Analyzing Data in Graph View. To retrieve data: 1. Open the Vernier DataQuest™ application. 2. Attach the TI-Nspire™ Lab Cradle to the handheld or computer. The Remote Data Detected dialog box opens. 3. Click Import. The data transfers - Texas Instruments TINSPIRE | Data Collection Guidebook - Page 75
Working with Advanced Analysis Features Use the Vernier DataQuest™ application advanced data analysis features to: • Replay the data collection. • Adjust derivative settings. • Draw a predictive plot. • Use Motion Match. • Examine graphs using the Page Layout view. Replaying the Data Collection Use - Texas Instruments TINSPIRE | Data Collection Guidebook - Page 76
2. Select the data set to replay from the Data Set drop-down list. Note: Changing the run in the Data Set selection tool does not affect the playback choice. You must specify which data set in Experiment > Replay > Advanced Settings. 3. (Optional) Select a new value from the Base Column drop-down - Texas Instruments TINSPIRE | Data Collection Guidebook - Page 77
Start to start the playback and save the settings. Adjusting Derivative Settings Use this option to select the number of points to use in derivative calculations. This value affects the tangent tool, velocity, and acceleration values. Find pH derivative settings using - Texas Instruments TINSPIRE | Data Collection Guidebook - Page 78
collected using sensors, input manually, or linked from other applications. The numerical derivative is found using a calculated column. To determine the numerical and Clearing a Predictive Plot You can add points to the graph to draw a prediction and you can remove the prediction. Drawing a Predictive - Texas Instruments TINSPIRE | Data Collection Guidebook - Page 79
1. Click Analyze > Draw Prediction > Draw. 2. Move the cursor over the graph, and then click each area in which you want to place a point. 3. Press Esc to release the drawing tool. Handheld: Press d. The following image is an example of a drawn prediction. Clearing the Prediction To clear the drawn - Texas Instruments TINSPIRE | Data Collection Guidebook - Page 80
• New Velocity Match. Generates a random velocity plot. The following image is an example of the Motion Match (New Velocity Match) generated plot: Note: Continue selecting a new position or a new velocity match to generate a new random plot without removing the existing plot. Removing a Motion Match - Texas Instruments TINSPIRE | Data Collection Guidebook - Page 81
computer. You can print any single displayed active view, or with the Print All option you can print: • One data view. • All of the data views. • A combination of the data views. The Print All option has no affect in applications All Views. All three views (Meter, Graph, & Table) are sent to the - Texas Instruments TINSPIRE | Data Collection Guidebook - Page 82
2. Select Print All from the Print What drop-down list. The Print dialog box opens. 3. Select additional options, if needed. 4. Click Print to send the document to the printer. 78 Printing Data - Texas Instruments TINSPIRE | Data Collection Guidebook - Page 83
application designed for using sensors with other TI-Nspire™ applications such as: • Graphs • Geometry • Data & Statistics • Lists & Spreadsheet When you perform experiments, TI collecting data: 1. Click Collect Data > Stop Collection. Handheld: Press b and select Collect Data > Stop Collection 2. - Texas Instruments TINSPIRE | Data Collection Guidebook - Page 84
Menus The Sensor Console menus are a subset of the Vernier DataQuest™ menus. Accessing the Application Menu on the Computer To access the Sensor Console menu: 1. Click anywhere on the Sensor Console bar. Handheld: Press b. 2. Click Collect Data. The Sensor Console menu opens. Note: To access options - Texas Instruments TINSPIRE | Data Collection Guidebook - Page 85
Data You can view data collected and stored from a different TI-Nspire™ application in the current application. 1. Open the document with the captured data set. For example, open the Graphs application. 2. Click Insert > [other application]. For example, insert Lists and Spreadsheet. The selected - Texas Instruments TINSPIRE | Data Collection Guidebook - Page 86
Page. Handheld: a) Click in the Sensor Console area. b) Press b, and then Collect Data > View Data in Apps on Current Page. Wait until the data is populated. After a few moments, the data is displayed. 5. Click Collect Data > Close Console. 82 Using the Sensors and Data with Other Applications - Texas Instruments TINSPIRE | Data Collection Guidebook - Page 87
. The following image is an example of existing data opened as a Dot Point graph in the Data and Statistics application. y-axis x-axis 1. Open the document containing the data set in the Data & Statistics application. 2. Click the text "Click to add variable" on the y-axis. 3. Select the variable - Texas Instruments TINSPIRE | Data Collection Guidebook - Page 88
84 Using the Sensors and Data with Other Applications - Texas Instruments TINSPIRE | Data Collection Guidebook - Page 89
The following sensors can be used with the Vernier DataQuest™ application. • 25-g Accelerometer • 3-Axis Accelerometer • Low-g Accelerometer • CBR 2™ - Connects directly to handheld USB port • Go! Motion - Connects directly to computer USB port • Extra Long Temperature Probe • Stainless Steel - Texas Instruments TINSPIRE | Data Collection Guidebook - Page 90
Pressure Sensor • Hand Dynamometer • Hand-Grip Heart Rate Monitor • Instrumentation Amplifier • Light Sensor • Magnetic Field Sensor • Microphone • Spirometer • Student Radiation Monitor • Thermocouple • TI-Light - Sold only with the CBL 2™ • TI-Temp - Sold only with the CBL 2™ • TI-Voltage - Sold - Texas Instruments TINSPIRE | Data Collection Guidebook - Page 91
• Vernier Infrared Thermometer • Vernier Photogate • Voltage Probe Compatible Sensors 87 - Texas Instruments TINSPIRE | Data Collection Guidebook - Page 92
88 Compatible Sensors - Texas Instruments TINSPIRE | Data Collection Guidebook - Page 93
sensors. Important: The TI-Nspire™ CM-C Handheld is not compatible with the Lab Cradle and only supports the use of a single sensor at a time. The Lab Cradle comes pre-loaded with its own operating system (OS). The TI-Nspire™ 3.0 operating system for handheld and computer software has been preset to - Texas Instruments TINSPIRE | Data Collection Guidebook - Page 94
The following graphic shows the front and back of the Lab Cradle. 1 5 2 6 7 3 8 4 9 10 1 TI-Nspire™ logo. The TI-Nspire™ name. 2 Analog ports. The three BT analog ports used to connect analog sensors. The other side of the cradle has two digital ports for digital sensors. 3 Battery panel and - Texas Instruments TINSPIRE | Data Collection Guidebook - Page 95
Lab Cradle's mini-USB port. Then plug the cable's standard USB connector into the computer's standard USB port. Defining Collection Parameters You must have the TI-Nspire™ software loaded on the computer or handheld. Use the built-in Vernier DataQuest™ app to: • Modify sensor settings. • Set up data - Texas Instruments TINSPIRE | Data Collection Guidebook - Page 96
You can connect the Lab Cradle to your handheld to collect or retrieve data. Using the Lab Cradle with a Computer The Lab Cradle works with all Windows® and Mac® operating systems currently supported by the TI-Nspire™ Teacher and Student computer software. Using the Lab Cradle as a Stand-Alone Data - Texas Instruments TINSPIRE | Data Collection Guidebook - Page 97
manual. To use automatic triggering, define the criteria in the Vernier DataQuest™ application when using the Lab Cradle with a computer or handheld. The Vernier DataQuest™ app starts a digital BT connectors. The Lab Cradle supports multi-channel data collection by allowing TI-Nspire™ Lab Cradle 93 - Texas Instruments TINSPIRE | Data Collection Guidebook - Page 98
the system is ready. • Slow blink: The Lab Cradle is updating experiment storage space. This is automatic behavior and does not impact active sampling. • Slow blink: The Lab Cradle is connected to a computer or handheld running TI-Nspire™ software but not set up for sampling. • Fast blink: The Lab - Texas Instruments TINSPIRE | Data Collection Guidebook - Page 99
There are two ways to view battery status: when attached to a handheld, or by looking at the LED light. When the Lab Cradle is attached to a TI-Nspire™ handheld, you can view the battery status for both. The first value is the handheld and the second value is the Lab Cradle. TI-Nspire™ Lab Cradle 95 - Texas Instruments TINSPIRE | Data Collection Guidebook - Page 100
a USB power source (either wall charger or computer): • Red - Slow blinking LED indicates the charge is low but charging. • Amber - Slow blinking LED indicates the Lab Cradle is charging • Green - Slow blinking LED indicates the Lab Cradle is fully charged. When in the TI-Nspire™ Cradle Charging Bay - Texas Instruments TINSPIRE | Data Collection Guidebook - Page 101
an external power source. When using the wall charger, TI-Nspire™ Cradle Charging Bay, or USB cable plugged into a powered computer, the Lab Cradle can be fully charged from a dead state in less than 12 hours when not being used. The battery is capable of supporting one full day of high-use, high - Texas Instruments TINSPIRE | Data Collection Guidebook - Page 102
an OS upgrade from the Texas Instruments website to a computer, and use a USB cable to install the OS on your TI-Nspire™ Lab Cradle. You will need an Internet connection and the appropriate USB cable to download the updates. Checking for Lab Cradle OS Updates When using TI-Nspire™ software, you - Texas Instruments TINSPIRE | Data Collection Guidebook - Page 103
In the TI-Nspire™ software, you can select to upgrade the operating system on a connected Lab Cradle from the following workspaces and menus: • In all versions of the software, you can select Help > Check for Handheld/Lab Cradle OS Update. Select a connected Lab Cradle in TI-Nspire™ Lab Cradle - Texas Instruments TINSPIRE | Data Collection Guidebook - Page 104
update the operating system. • In all versions of the TI-Nspire™ software, you can use options available in the Documents Workspace: - Open Content Explorer, select the Lab Cradle name, and then click and select Install OS. -or- - Select Tools > Install Handheld/Lab Cradle OS. • Those using teacher - Texas Instruments TINSPIRE | Data Collection Guidebook - Page 105
to the file type required for the selected Lab Cradle. 1. Select the OS file TI-Nspire.tlo. 2. Click Install OS to download the OS and update the Lab Cradle. The confirmation message "You are about to upgrade your handheld/Lab Cradle operating system. Any unsaved data will be lost. Do you want - Texas Instruments TINSPIRE | Data Collection Guidebook - Page 106
102 TI-Nspire™ Lab Cradle - Texas Instruments TINSPIRE | Data Collection Guidebook - Page 107
contact Texas Instruments Customer Support before returning a product for service. For All Other Countries: For general information For more information about TI products and services, contact TI by e-mail or visit the TI Internet address. E-mail inquiries: Home Page: [email protected] education.ti - Texas Instruments TINSPIRE | Data Collection Guidebook - Page 108
risk of explosion if a battery is replaced by the wrong type. Disposing of Batteries Do not mutilate, puncture, or dispose of batteries in fire. The batteries can burst or explode, releasing hazardous chemicals. Discard used batteries according to local regulations. 104 Appendix: Service and Support - Texas Instruments TINSPIRE | Data Collection Guidebook - Page 109
14 data to columns manually 43 problems to documents 10 titles to graphs 28 analysis options removing 58 analyzing data curve fit 56 integral 54 model 58 statistics 55 tangent 53 applications Vernier DataQuest™ 1 axis ranges setting in graphs 29 C calculations derivative settings 73 collection - Texas Instruments TINSPIRE | Data Collection Guidebook - Page 110
remote data 70 inserting Vernier DataQuest™ application 3 interfaces multi-channel sensors 6 single-channel sensors 6 intervals 13 L Lab Cradle battery status 95 LEDs 94 overview 94 setting up 91 upgrading OS 98 LED lights Lab Cradle 70 sensors 65 linking columns to symbol table 41 M measurement - Texas Instruments TINSPIRE | Data Collection Guidebook - Page 111
77 problems adding to graphs 33 selecting columns 39 data ranges 34 data sets for replays 72 data sets to plot 32 Sensor Console menus 80 using with other applications 79 view 79 sensors calibrating 11 changing measurement units 10 connecting 10 for computers 8 for handhelds table linking columns - Texas Instruments TINSPIRE | Data Collection Guidebook - Page 112
manually 67 methods 93 using delays 68 U Upgrading the OS 99 V Vernier DataQuest™ application 1 viewing collected data details 51 data collections 81 views Graph 3 Meter 3 Page Layout 25 Sensor Console 79 Table 3 Z zooming in 35 out 35 108
-
 1
1 -
 2
2 -
 3
3 -
 4
4 -
 5
5 -
 6
6 -
 7
7 -
8
-
9
-
10
-
11
-
12
-
13
-
14
-
15
-
16
-
17
-
18
-
19
-
20
-
21
-
22
-
23
-
24
-
25
-
26
-
27
-
28
-
29
-
30
-
31
-
32
-
33
-
34
-
35
-
36
-
37
-
38
-
39
-
40
-
41
-
42
-
43
-
44
-
45
-
46
-
47
-
48
-
49
-
50
-
51
-
52
-
53
-
54
-
55
-
56
-
57
-
58
-
59
-
60
-
61
-
62
-
63
-
64
-
65
-
66
-
67
-
68
-
69
-
70
-
71
-
72
-
73
-
74
-
75
-
76
-
77
-
78
-
79
-
80
-
81
-
82
-
83
-
84
-
85
-
86
-
87
-
88
-
89
-
90
-
91
-
92
-
93
-
94
-
95
-
96
-
97
-
98
-
99
-
100
-
101
-
102
-
103
-
104
-
105
-
106
-
107
-
108
-
109
-
110
-
111
-
112
 |
 |

TI-Nspire™
Data Collection
and Analysis Guidebook
This guidebook applies to TI-Nspire™ software version 3.1. To obtain the
latest version of the documentation, go to
education.ti.com/guides
.