Texas Instruments TI-30XS User Manual - Page 31
Statistics - standard deviation
 |
UPC - 033317190379
View all Texas Instruments TI-30XS manuals
Add to My Manuals
Save this manual to your list of manuals |
Page 31 highlights
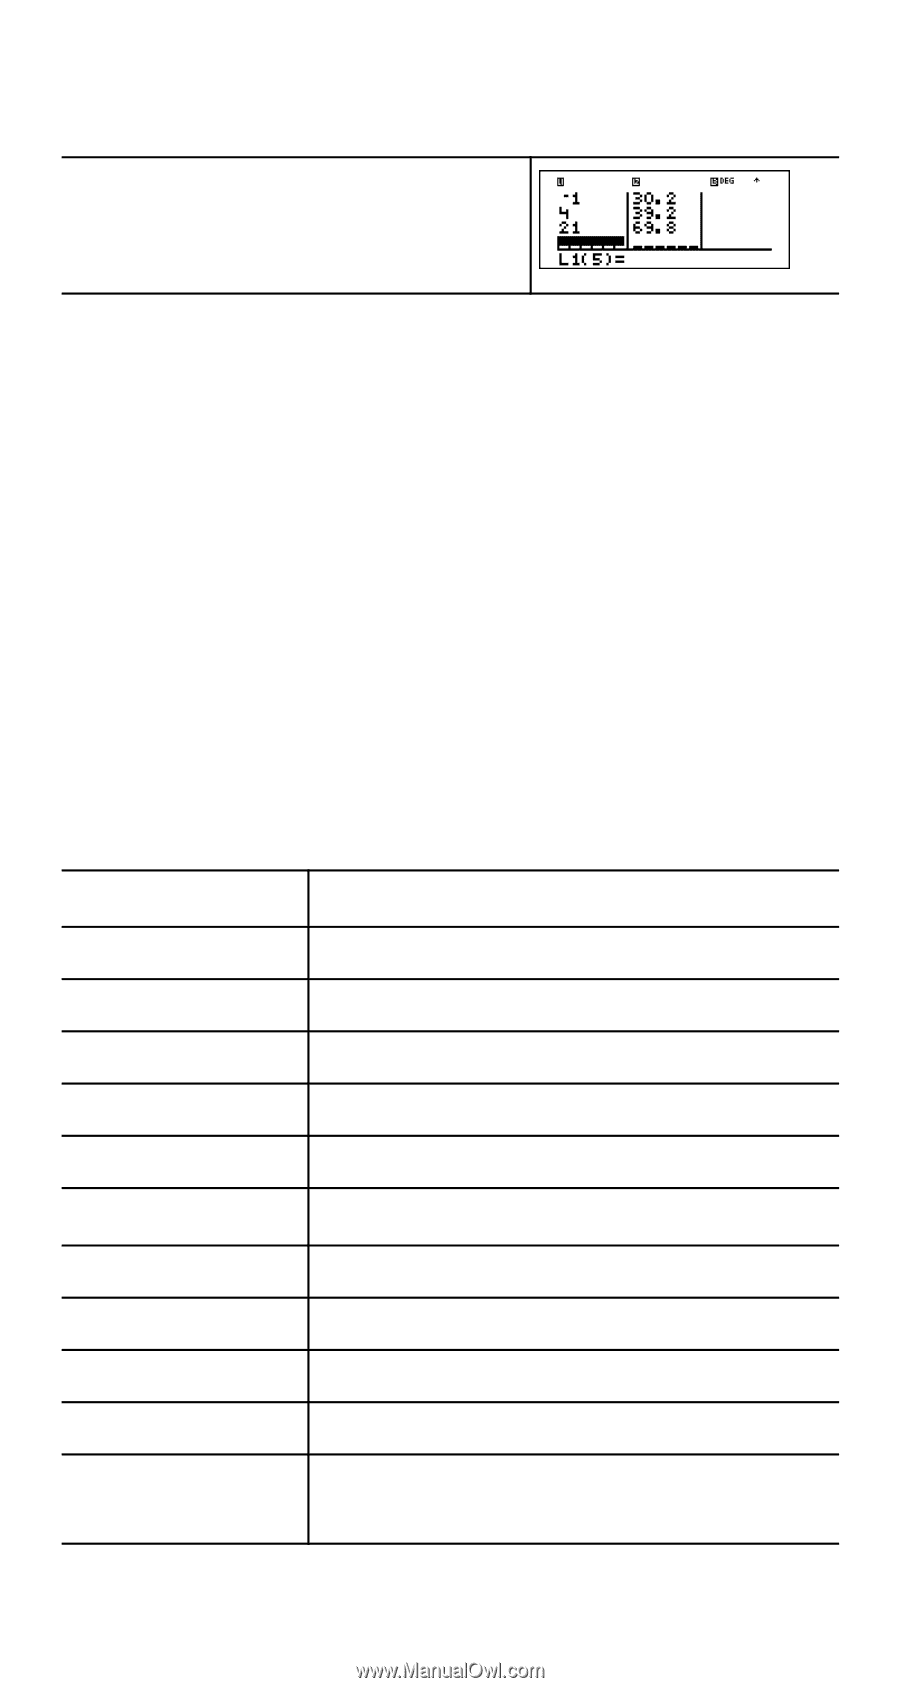
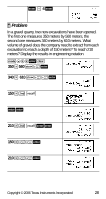
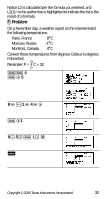
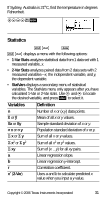
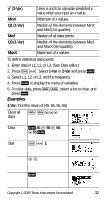
If Sydney, Australia is 21ÄC, find the temperature in degrees Fahrenheit. !$$$21 < Statistics % t v % t displays a menu with the following options: • 1-Var Stats analyzes statistical data from 1 data set with 1 measured variable, x. • 2-Var Stats analyzes paired data from 2 data sets with 2 measured variables-x, the independent variable, and y, the dependent variable. • StatVars displays a secondary menu of statistical variables. The StatVars menu only appears after you have calculated 1-Var or 2-Var stats. Use $ and # to locate the desired variable, and press < to select it. Variables Definition n Ï or Ð Number of x or (x,y) data points. Mean of all x or y values. Sx or Sy Îx or Îy Òx or Òy Sample standard deviation of x or y. Population standard deviation of x or y. Sum of all x or y values. Òx2 or Òy2 Sum of all x2 or y2 values. Òxy Sum of (x ...y) for all xy pairs. a Linear regression slope. b Linear regression y-intercept. r Correlation coefficient. xÅ (2-Var) Uses a and b to calculate predicted x value when you input a y value. Copyright © 2006 Texas Instruments Incorporated 31
-
 1
1 -
2
-
3
-
4
-
5
-
6
-
7
-
8
-
9
-
10
-
11
-
12
-
13
-
14
-
15
-
16
-
17
-
18
-
19
-
20
-
21
-
22
-
23
-
24
-
25
-
 26
26 -
 27
27 -
 28
28 -
 29
29 -
 30
30 -
 31
31 -
 32
32 -
 33
33 -
 34
34 -
 35
35 -
 36
36 -
37
-
38
-
39
-
40
-
41
-
42
-
43
-
44
 |
 |