Texas Instruments TI-30XS User Manual - Page 32
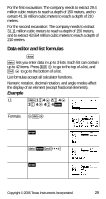
Enter data in L1, L2, or L3. See Data editor. - how to use
 |
UPC - 033317190379
View all Texas Instruments TI-30XS manuals
Add to My Manuals
Save this manual to your list of manuals |
Page 32 highlights
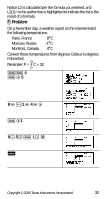
yÅ (2-Var) Uses a and b to calculate predicted y value when you input an x value. MinX Minimum of x values. Q1 (1-Var) Median of the elements between MinX and Med (1st quartile). Med Median of all data points. Q3 (1-Var) Median of the elements between Med and MaxX (3rd quartile). MaxX Maximum of x values. To define statistical data points: 1. Enter data in L1, L2, or L3. (See Data editor.) 2. Press % t. Select 1-Var or 2-Var and press
-
 1
1 -
2
-
3
-
4
-
5
-
6
-
7
-
8
-
9
-
10
-
11
-
12
-
13
-
14
-
15
-
16
-
17
-
18
-
19
-
20
-
21
-
22
-
23
-
24
-
25
-
26
-
 27
27 -
 28
28 -
 29
29 -
 30
30 -
 31
31 -
 32
32 -
 33
33 -
 34
34 -
 35
35 -
 36
36 -
 37
37 -
38
-
39
-
40
-
41
-
42
-
43
-
44
 |
 |
Copyright © 2006 Texas Instruments Incorporated
32
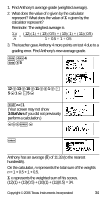
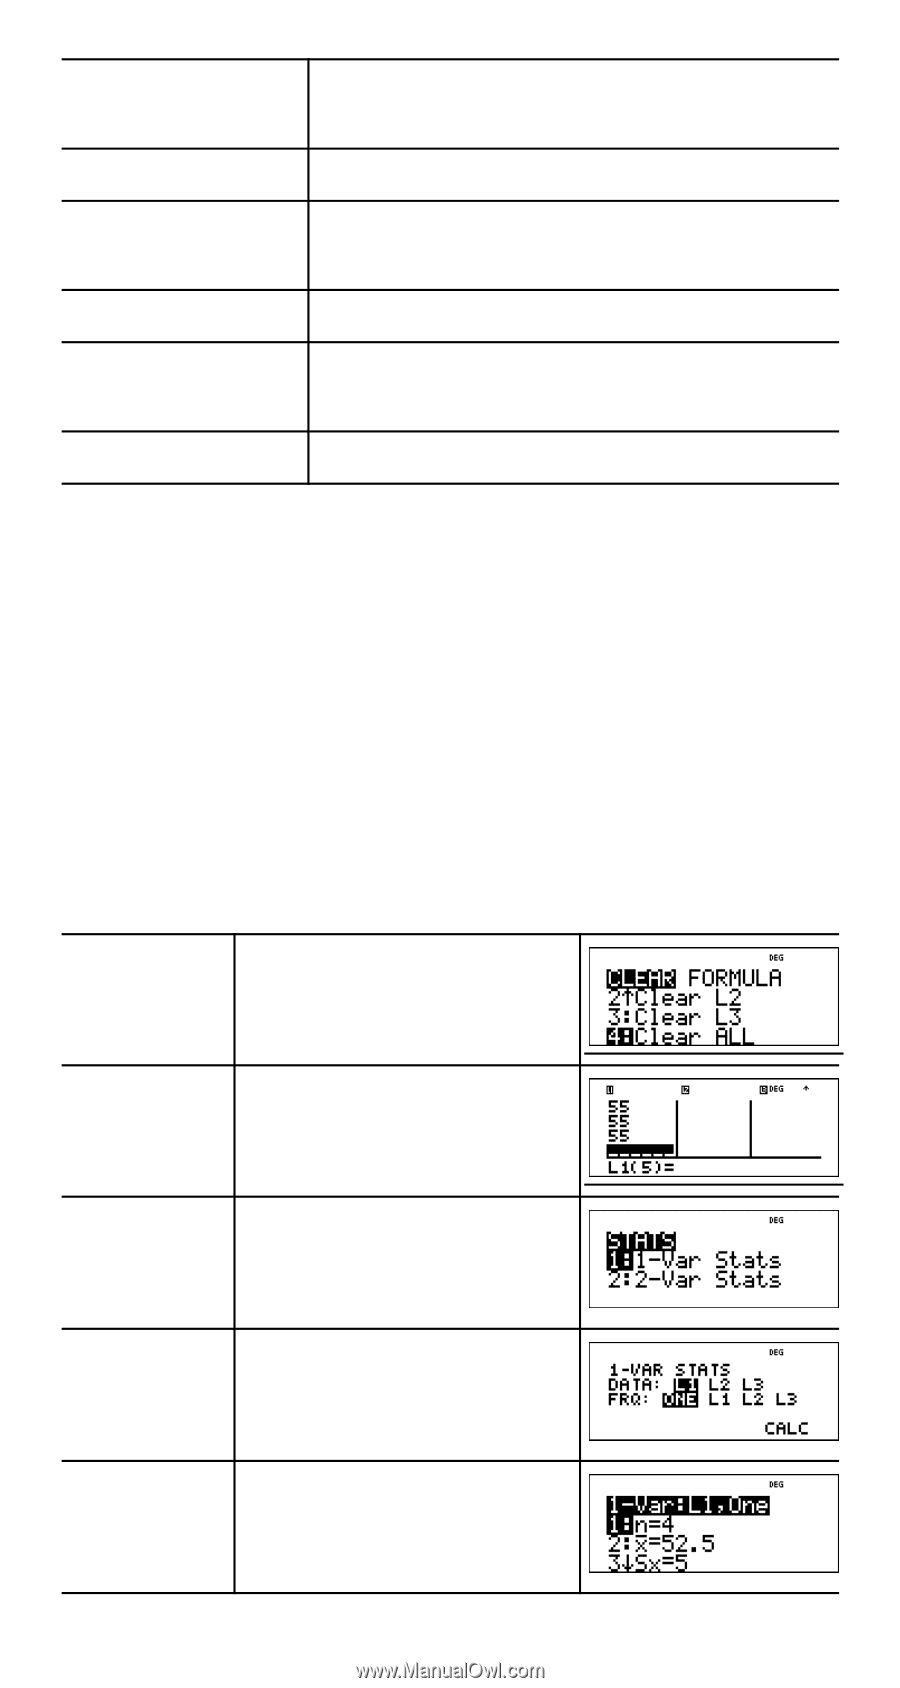
To define statistical data points:
1.
Enter data in L1, L2, or L3. (See Data editor.)
2. Press
% t
. Select
1-Var
or
2-Var
and press
<
.
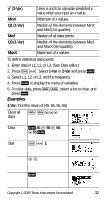
3.
Select L1, L2, or L3, and the frequency.
4. Press
<
to display the menu of variables.
5.
To clear data, press
v v
,
select a list to clear, and
press
<
.
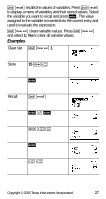
Examples
1-Var:
Find the mean of {45, 55, 55, 55}
y
Å
(
2-Var
)
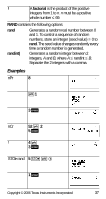
Uses
a
and
b
to calculate predicted
y
value when you input an
x
value.
MinX
Minimum of
x
values.
Q1 (1-Var)
Median of the elements between MinX
and Med (1st quartile).
Med
Median of all data points.
Q3 (1-Var)
Median of the elements between Med
and MaxX (3rd quartile).
MaxX
Maximum of
x
values.
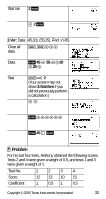
Clear all
data
v v$$$
Data
<
45
$
55
$
55
$
55
<
Stat
%
t
1
$ $
<