Texas Instruments TI-34 User Manual - Page 35
Enter data in L1, L2, or L3. See Data editor.
 |
UPC - 331719036203
View all Texas Instruments TI-34 manuals
Add to My Manuals
Save this manual to your list of manuals |
Page 35 highlights
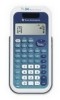
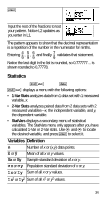
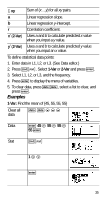
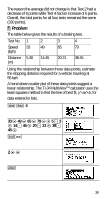
Σ xy Sum of (x ...y) for all xy pairs. a Linear regression slope. b Linear regression y-intercept. r Correlation coefficient. x' (2-Var) Uses a and b to calculate predicted x value when you input a y value. y' (2-Var) Uses a and b to calculate predicted y value when you input an x value. To define statistical data points: 1. Enter data in L1, L2, or L3. (See Data editor.) 2. Press %t. Select 1-Var or 2-Var and press
-
 1
1 -
2
-
3
-
4
-
5
-
6
-
7
-
8
-
9
-
10
-
11
-
12
-
13
-
14
-
15
-
16
-
17
-
18
-
19
-
20
-
21
-
22
-
23
-
24
-
25
-
26
-
27
-
28
-
29
-
 30
30 -
 31
31 -
 32
32 -
 33
33 -
 34
34 -
 35
35 -
 36
36 -
 37
37 -
 38
38 -
 39
39 -
 40
40 -
41
-
42
-
43
-
44
-
45
 |
 |

35
To define statistical data points:
1.
Enter data in L1, L2, or L3. (See Data editor.)
2. Press
%t
. Select
1-Var
or
2-Var
and press
<
.
3.
Select L1, L2, or L3, and the frequency.
4. Press
<
to display the menu of variables.
5.
To clear data, press
vv
, select a list to clear, and
press
<
.
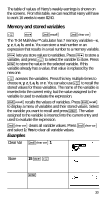
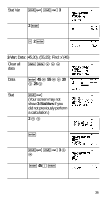
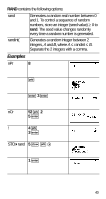
Examples
1-Var:
Find the mean of
{45, 55, 55, 55}
xy
Sum of (
x
…
y
) for all
xy
pairs.
a
Linear regression slope.
b
Linear regression
y
-intercept.
r
Correlation coefficient.
x
'
(
2-Var
)
Uses
a
and
b
to calculate predicted
x
value
when you input a
y
value.
y
'
(
2-Var
)
Uses
a
and
b
to calculate predicted
y
value
when you input an
x
value.
Clear all
data
v v $ $ $
Data
<
45
$
55
$
55
$
55
<
Stat
%t
1
$ $
<
Σ