Texas Instruments TI-36X Pro User Manual - Page 36
Statistics, regressions, and distributions
 |
View all Texas Instruments TI-36X Pro manuals
Add to My Manuals
Save this manual to your list of manuals |
Page 36 highlights
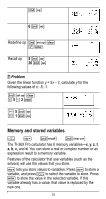
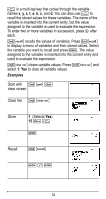
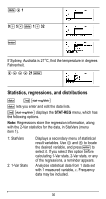
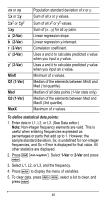
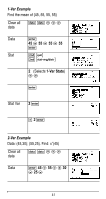
v " 1 9 W 5 V v 1 T 32 < If Sydney, Australia is 21¡C, find the temperature in degrees Fahrenheit. ! $ $ $ 21 < Statistics, regressions, and distributions v %u v lets you enter and edit the data lists. % u displays the STAT-REG menu, which has the following options. Note: Regressions store the regression information, along with the 2-Var statistics for the data, in StatVars (menu item 1). 1: StatVars 2: 1-Var Stats Displays a secondary menu of statistical result variables. Use $ and # to locate the desired variable, and press < to select it. If you select this option before calculating 1-Var stats, 2-Var stats, or any of the regressions, a reminder appears. Analyzes statistical data from 1 data set with 1 measured variable, x. Frequency data may be included. 36
-
 1
1 -
2
-
3
-
4
-
5
-
6
-
7
-
8
-
9
-
10
-
11
-
12
-
13
-
14
-
15
-
16
-
17
-
18
-
19
-
20
-
21
-
22
-
23
-
24
-
25
-
26
-
27
-
28
-
29
-
30
-
 31
31 -
 32
32 -
 33
33 -
 34
34 -
 35
35 -
 36
36 -
 37
37 -
 38
38 -
 39
39 -
 40
40 -
 41
41 -
42
-
43
-
44
-
45
-
46
-
47
-
48
-
49
-
50
-
51
-
52
-
53
-
54
-
55
-
56
-
57
-
58
-
59
-
60
-
61
-
62
-
63
-
64
-
65
-
66
-
67
-
68
-
69
-
70
-
71
-
72
-
73
-
74
-
75
-
76
-
77
-
78
 |
 |