Texas Instruments TI-36X Pro User Manual - Page 40
To define statistical data points
 |
View all Texas Instruments TI-36X Pro manuals
Add to My Manuals
Save this manual to your list of manuals |
Page 40 highlights
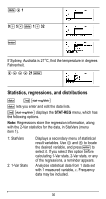
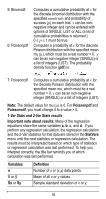
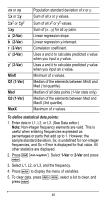
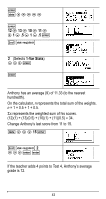
sx or sy Gx or Gy Gx2 or Gy2 Gxy a (2-Var) b (2-Var) r (2-Var) x¢ (2-Var) y¢ (2-Var) MinX Q1 (1-Var) Med Q3 (1-Var) MaxX Population standard deviation of x or y. Sum of all x or y values. Sum of all x2 or y2 values. Sum of (x...y) for all xy pairs. Linear regression slope. Linear regression y-intercept. Correlation coefficient. Uses a and b to calculate predicted x value when you input a y value. Uses a and b to calculate predicted y value when you input an x value. Minimum of x values. Median of the elements between MinX and Med (1st quartile). Median of all data points (1-Var stats only). Median of the elements between Med and MaxX (3rd quartile). Maximum of x values. To define statistical data points: 1. Enter data in L1, L2, or L3. (See Data editor.) Note: Non-integer frequency elements are valid. This is useful when entering frequencies expressed as percentages or parts that add up to 1. However, the sample standard deviation, Sx, is undefined for non-integer frequencies, and Sx = Error is displayed for that value. All other statistics are displayed. 2. Press % u. Select 1-Var or 2-Var and press
-
 1
1 -
2
-
3
-
4
-
5
-
6
-
7
-
8
-
9
-
10
-
11
-
12
-
13
-
14
-
15
-
16
-
17
-
18
-
19
-
20
-
21
-
22
-
23
-
24
-
25
-
26
-
27
-
28
-
29
-
30
-
31
-
32
-
33
-
34
-
 35
35 -
 36
36 -
 37
37 -
 38
38 -
 39
39 -
 40
40 -
 41
41 -
 42
42 -
 43
43 -
 44
44 -
 45
45 -
46
-
47
-
48
-
49
-
50
-
51
-
52
-
53
-
54
-
55
-
56
-
57
-
58
-
59
-
60
-
61
-
62
-
63
-
64
-
65
-
66
-
67
-
68
-
69
-
70
-
71
-
72
-
73
-
74
-
75
-
76
-
77
-
78
 |
 |