Texas Instruments TI-36X Pro User Manual - Page 44
method to find the line of best fit
 |
View all Texas Instruments TI-36X Pro manuals
Add to My Manuals
Save this manual to your list of manuals |
Page 44 highlights
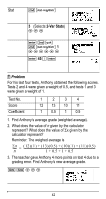
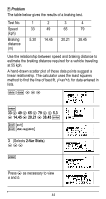
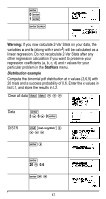
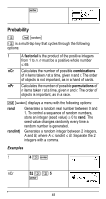
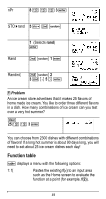
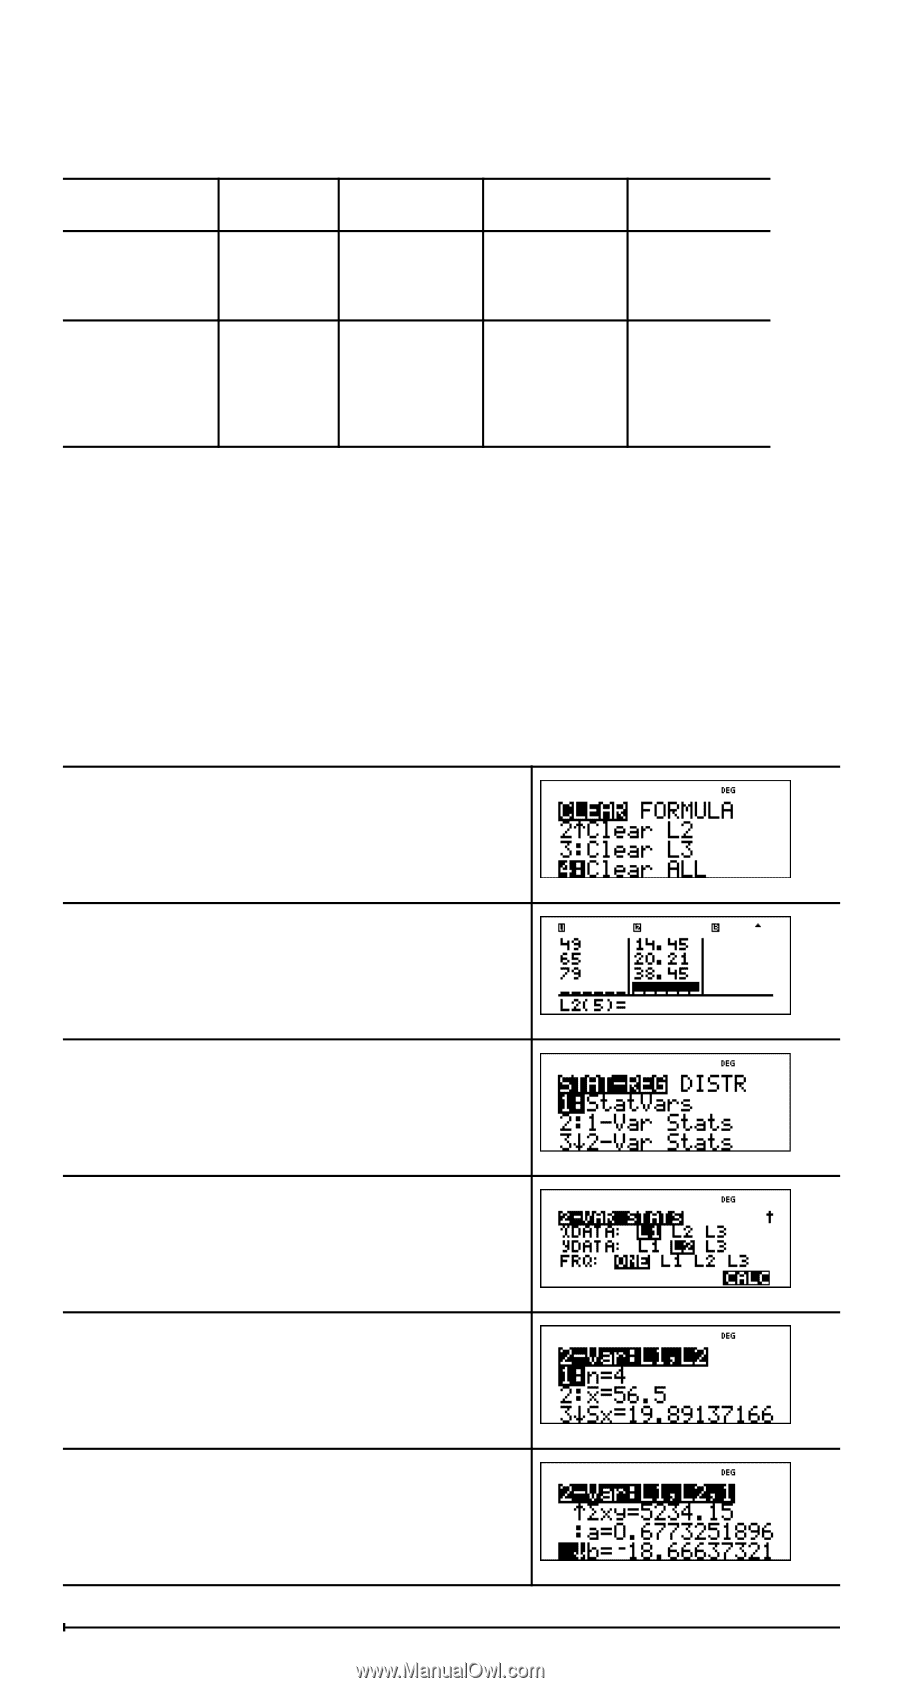
³ Problem The table below gives the results of a braking test. Test No. Speed (kph) Braking distance (m) 1 2 33 49 5.30 14.45 3 65 20.21 4 79 38.45 Use the relationship between speed and braking distance to estimate the braking distance required for a vehicle traveling at 55 kph. A hand-drawn scatter plot of these data points suggest a linear relationship. The calculator uses the least squares method to find the line of best fit, y'=ax'+b, for data entered in lists. v v $ $ $ < 33 $ 49 $ 65 $ 79 $ " 5.3 $ 14.45 $ 20.21 $ 38.45 < %s %u 3 (Selects 2-Var Stats) $ $ $ < Press $ as necessary to view a and b. 44
-
 1
1 -
2
-
3
-
4
-
5
-
6
-
7
-
8
-
9
-
10
-
11
-
12
-
13
-
14
-
15
-
16
-
17
-
18
-
19
-
20
-
21
-
22
-
23
-
24
-
25
-
26
-
27
-
28
-
29
-
30
-
31
-
32
-
33
-
34
-
35
-
36
-
37
-
38
-
 39
39 -
 40
40 -
 41
41 -
 42
42 -
 43
43 -
 44
44 -
 45
45 -
 46
46 -
 47
47 -
 48
48 -
 49
49 -
50
-
51
-
52
-
53
-
54
-
55
-
56
-
57
-
58
-
59
-
60
-
61
-
62
-
63
-
64
-
65
-
66
-
67
-
68
-
69
-
70
-
71
-
72
-
73
-
74
-
75
-
76
-
77
-
78
 |
 |
44
³
Problem
The table below gives the results of a braking test.
Use the relationship between speed and braking distance to
estimate the braking distance required for a vehicle traveling
at 55 kph.
A hand-drawn scatter plot of these data points suggest a
linear relationship. The calculator uses the least squares
method to find the line of best fit,
y
'=
ax
'+
b
, for data entered in
lists.
Test No.
1
2
3
4
Speed
(kph)
33
49
65
79
Braking
distance
(m)
5.30
14.45
20.21
38.45
v
v
$
$
$
<
33
$
49
$
65
$
79
$
"
5.3
$
14.45
$
20.21
$
38.45
<
%s
%u
3
(Selects
2-Var Stats
)
$
$ $
<
Press
$
as necessary to view
a
and
b.