Texas Instruments TI-36X Pro User Manual - Page 46
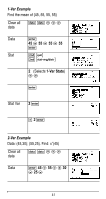
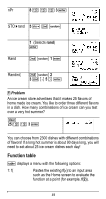
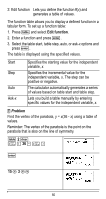
L1 = {0, 1, 2, 3, 4}; L2 = {10, 14, 23, 35, 48}
 |
View all Texas Instruments TI-36X Pro manuals
Add to My Manuals
Save this manual to your list of manuals |
Page 46 highlights
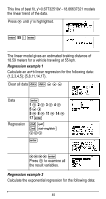
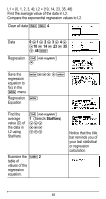
L1 = {0, 1, 2, 3, 4}; L2 = {10, 14, 23, 35, 48} Find the average value of the data in L2. Compare the exponential regression values to L2. Clear all data v v 4 Data 0 $1 $ 2 $ 3 $ 4 $ "10 $ 14 $ 23 $ 35 $ 48 < Regression % u # Save the
-
 1
1 -
2
-
3
-
4
-
5
-
6
-
7
-
8
-
9
-
10
-
11
-
12
-
13
-
14
-
15
-
16
-
17
-
18
-
19
-
20
-
21
-
22
-
23
-
24
-
25
-
26
-
27
-
28
-
29
-
30
-
31
-
32
-
33
-
34
-
35
-
36
-
37
-
38
-
39
-
40
-
 41
41 -
 42
42 -
 43
43 -
 44
44 -
 45
45 -
 46
46 -
 47
47 -
 48
48 -
 49
49 -
 50
50 -
 51
51 -
52
-
53
-
54
-
55
-
56
-
57
-
58
-
59
-
60
-
61
-
62
-
63
-
64
-
65
-
66
-
67
-
68
-
69
-
70
-
71
-
72
-
73
-
74
-
75
-
76
-
77
-
78
 |
 |
46
L1 = {0, 1, 2, 3, 4}; L2 = {10, 14, 23, 35, 48}
Find the average value of the data in L2.
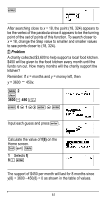
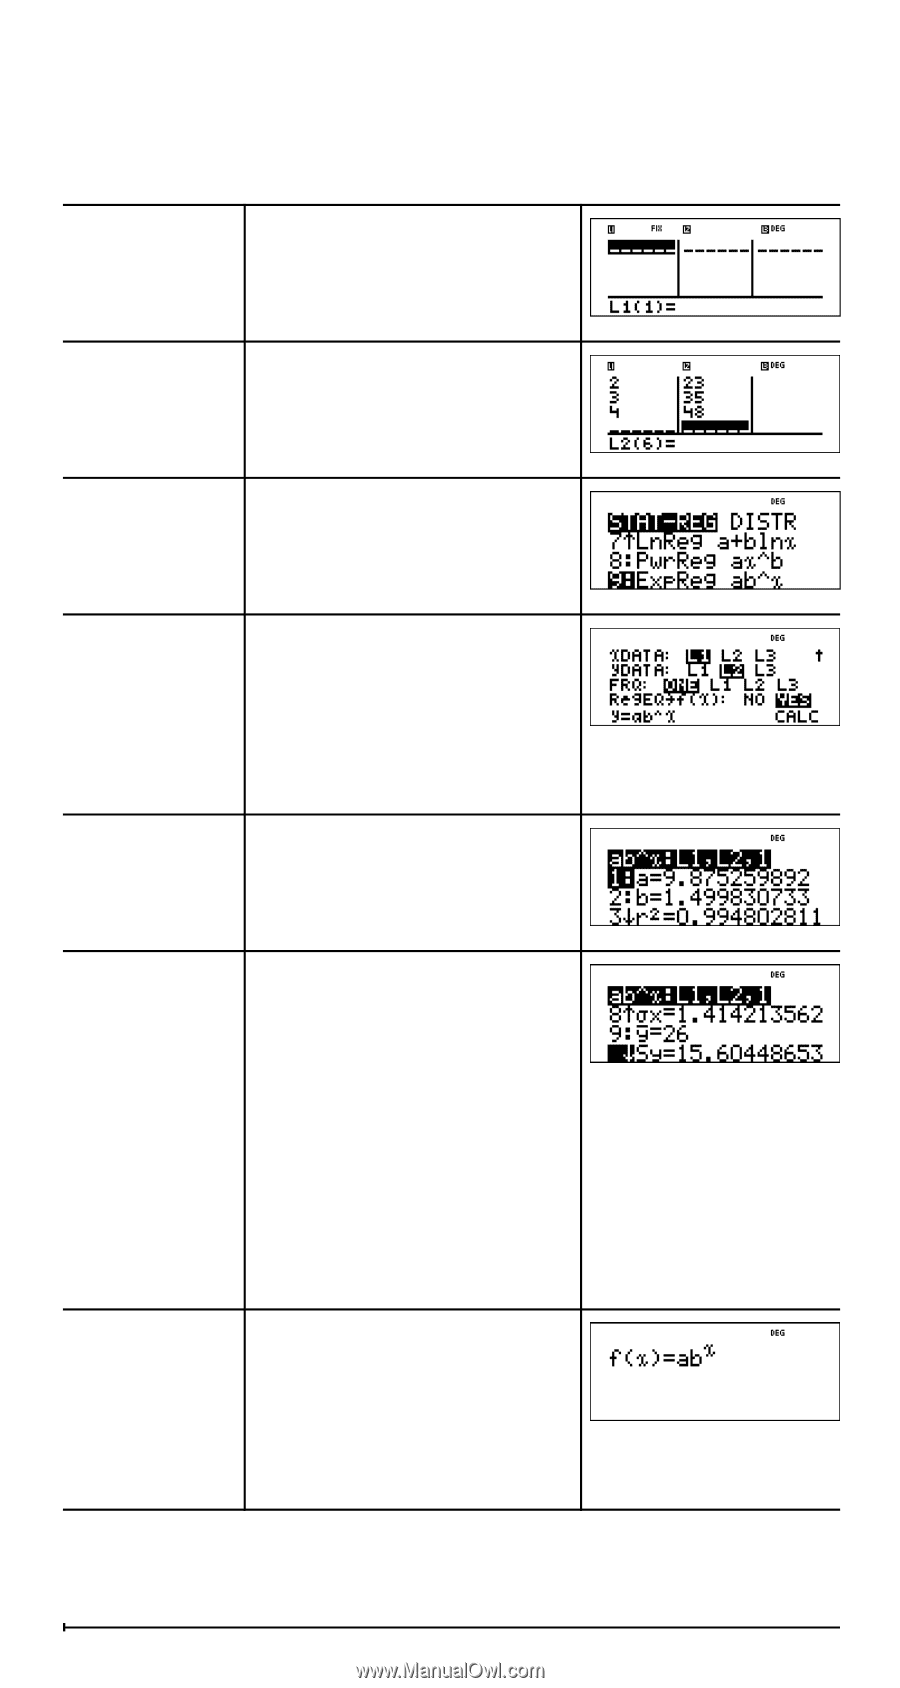
Compare the exponential regression values to L2.
Clear all data
v
v
4
Data
0
$
1
$
2
$
3
$
4
$
"
10
$
14
$
23
$
35
$
48
<
Regression
%
u
#
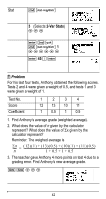
Save the
regression
equation to
f(x) in the
I
menu.
<$$$
" <
Regression
Equation
<
Find the
average
value (
y
) of
the data in
L2 using
StatVars.
%
u
1
(Selects
StatVars
)
$$$
$$$
$$$
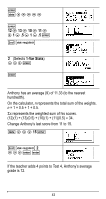
Notice that the title
bar reminds you of
your last statistical
or regression
calculation.
Examine the
table of
values of the
regression
equation.
I
2