ZyXEL NBG-418N User Guide - Page 41
Summary: Packet Statistics
 |
View all ZyXEL NBG-418N manuals
Add to My Manuals
Save this manual to your list of manuals |
Page 41 highlights
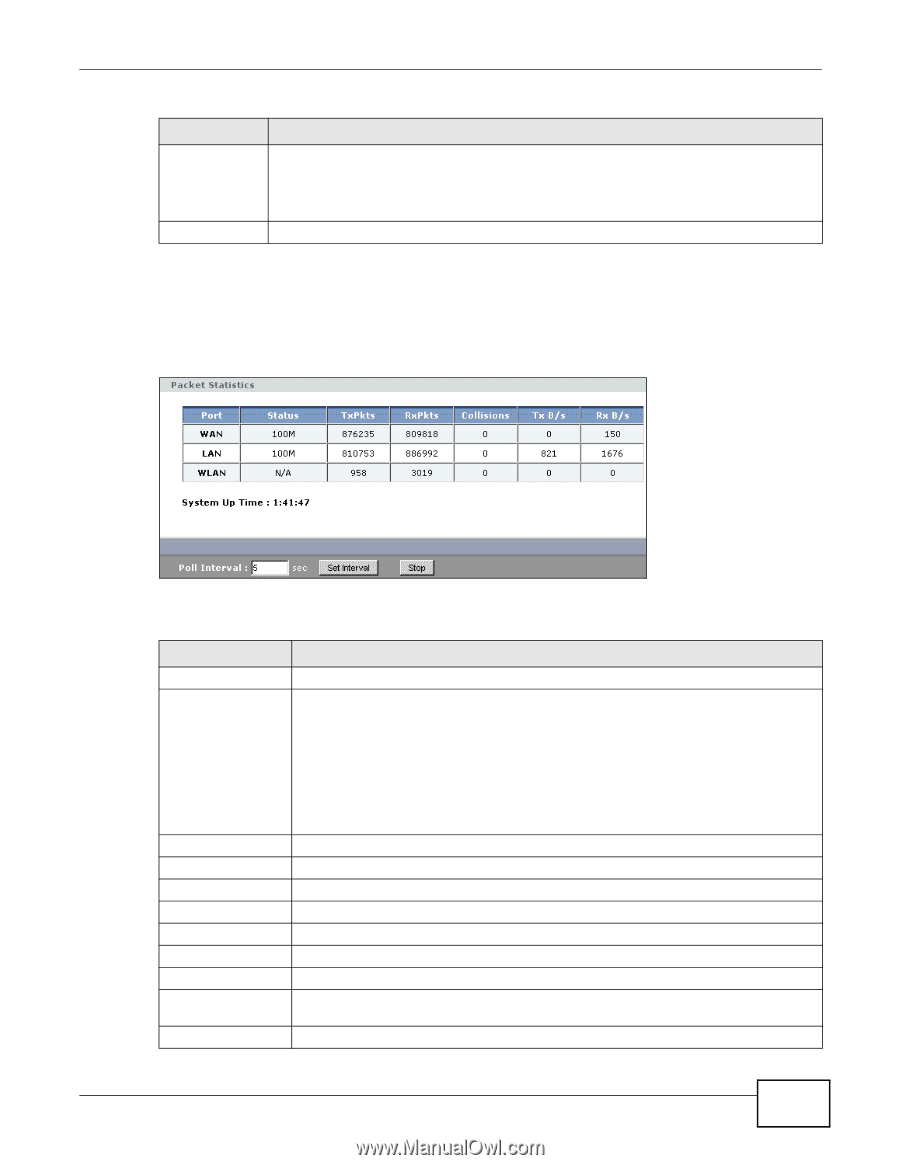
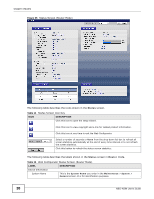
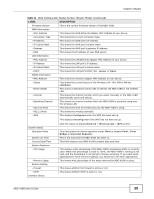
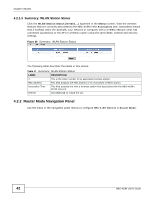
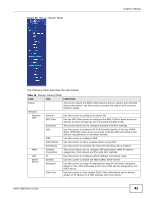
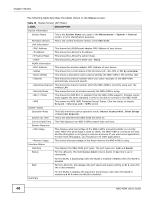
Chapter 4 Modes Table 15 Summary: DHCP Table (continued) LABEL MAC Address DESCRIPTION This field shows the MAC address of the computer with the name in the Host Name field. Refresh Every Ethernet device has a unique MAC (Media Access Control) address which uniquely identifies a device. The MAC address is assigned at the factory and consists of six pairs of hexadecimal characters, for example, 00:A0:C5:00:00:02. Click Refresh to renew the screen. 4.2.1.2 Summary: Packet Statistics Click the Packet Statistics (Details...) hyperlink in the Status screen. Read-only information here includes port status, packet specific statistics and the "system up time". The Poll Interval(s) field is configurable and is used for refreshing the screen. Figure 27 Summary: Packet Statistics The following table describes the labels in this screen. Table 16 Summary: Packet Statistics LABEL Port Status DESCRIPTION This is the NBG-418N's port type. For the LAN ports, this displays the port speed and duplex setting or Down when the line is disconnected. For the WAN port, it displays the port speed and duplex setting if you're using Ethernet encapsulation and Idle (line (ppp) idle), Dial (starting to trigger a call) and Drop (dropping a call) if you're using PPPoE or PPTP encapsulation. This field displays Down when the line is disconnected. TxPkts RxPkts Collisions Tx B/s Rx B/s System Up Time Poll Interval(s) Set Interval Stop For the WLAN, it displays the maximum transmission rate when the WLAN is enabled and Down when the WLAN is disabled. This is the number of transmitted packets on this port. This is the number of received packets on this port. This is the number of collisions on this port. This displays the transmission speed in bytes per second on this port. This displays the reception speed in bytes per second on this port. This is the total time the NBG-418N has been on. Enter the time interval for refreshing statistics in this field. Click this button to apply the new poll interval you entered in the Poll Interval(s) field. Click Stop to stop refreshing statistics. NBG-418N User's Guide 41
-
 1
1 -
2
-
3
-
4
-
5
-
6
-
7
-
8
-
9
-
10
-
11
-
12
-
13
-
14
-
15
-
16
-
17
-
18
-
19
-
20
-
21
-
22
-
23
-
24
-
25
-
26
-
27
-
28
-
29
-
30
-
31
-
32
-
33
-
34
-
35
-
 36
36 -
 37
37 -
 38
38 -
 39
39 -
 40
40 -
 41
41 -
 42
42 -
 43
43 -
 44
44 -
 45
45 -
 46
46 -
47
-
48
-
49
-
50
-
51
-
52
-
53
-
54
-
55
-
56
-
57
-
58
-
59
-
60
-
61
-
62
-
63
-
64
-
65
-
66
-
67
-
68
-
69
-
70
-
71
-
72
-
73
-
74
-
75
-
76
-
77
-
78
-
79
-
80
-
81
-
82
-
83
-
84
-
85
-
86
-
87
-
88
-
89
-
90
-
91
-
92
-
93
-
94
-
95
-
96
-
97
-
98
-
99
-
100
-
101
-
102
-
103
-
104
-
105
-
106
-
107
-
108
-
109
-
110
-
111
-
112
-
113
-
114
-
115
-
116
-
117
-
118
-
119
-
120
-
121
-
122
-
123
-
124
-
125
-
126
-
127
-
128
-
129
-
130
-
131
-
132
-
133
-
134
-
135
-
136
-
137
-
138
-
139
-
140
-
141
-
142
-
143
-
144
-
145
-
146
-
147
-
148
-
149
-
150
-
151
-
152
-
153
-
154
-
155
-
156
-
157
-
158
-
159
-
160
-
161
-
162
-
163
-
164
-
165
-
166
-
167
-
168
-
169
-
170
-
171
-
172
-
173
-
174
-
175
-
176
-
177
-
178
-
179
-
180
-
181
-
182
-
183
-
184
-
185
-
186
-
187
-
188
-
189
-
190
-
191
-
192
-
193
-
194
-
195
-
196
-
197
-
198
-
199
-
200
-
201
-
202
-
203
-
204
-
205
-
206
-
207
-
208
-
209
-
210
-
211
-
212
-
213
-
214
-
215
-
216
-
217
-
218
-
219
-
220
-
221
-
222
-
223
-
224
 |
 |