ZyXEL P-2812HNU-F1 User Guide - Page 85
Connection Status and System Info, P-2812HNUL-Fx Series User's Guide
 |
View all ZyXEL P-2812HNU-F1 manuals
Add to My Manuals
Save this manual to your list of manuals |
Page 85 highlights
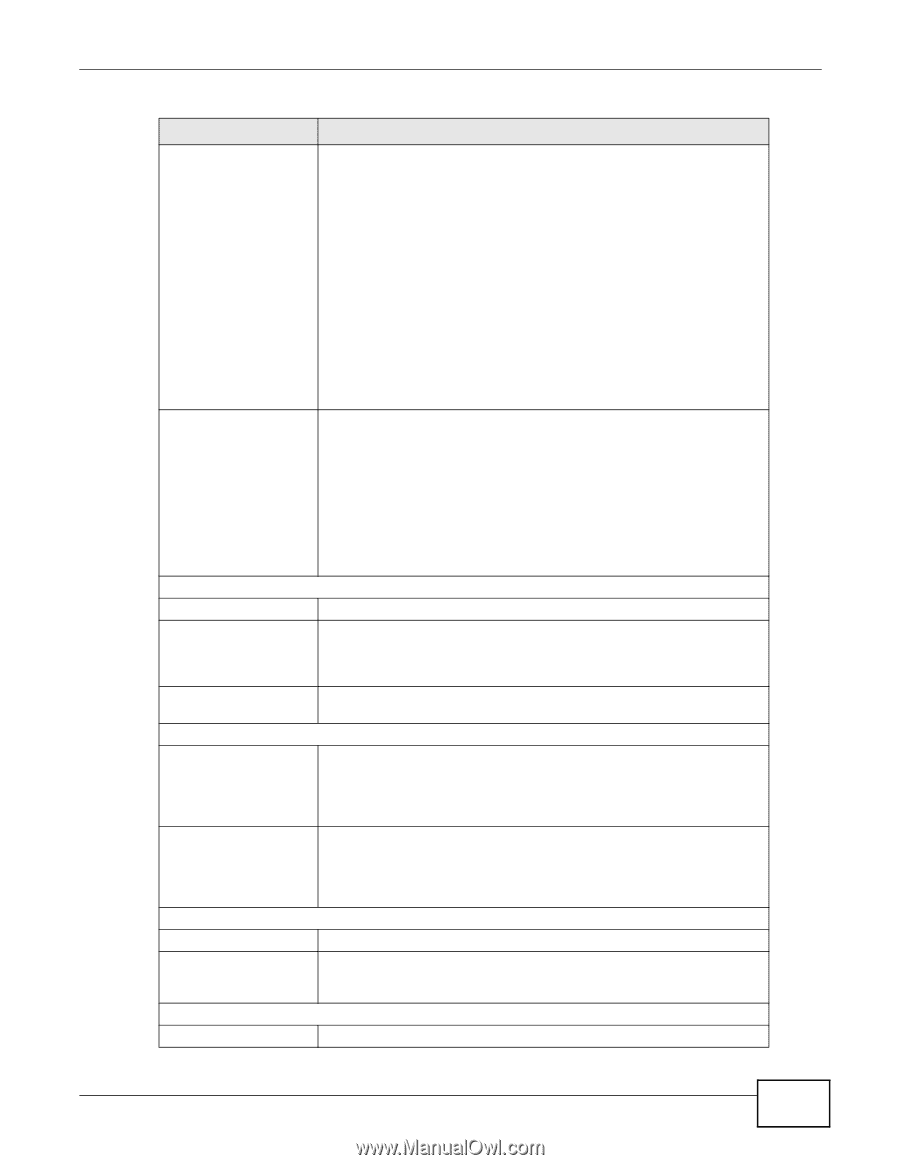
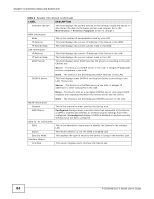
Chapter 4 Connection Status and System Info Table 4 System Info Screen (continued) LABEL DESCRIPTION Status This field indicates whether or not the Device is using the interface. For the DSL interface, this field displays Down (line is down), Up (line is up or connected) if you're using Ethernet encapsulation and Down (line is down), Up (line is up or connected), Idle (line (ppp) idle), Dial (starting to trigger a call) and Drop (dropping a call) if you're using PPPoE encapsulation. For the WAN interface, this field displays Up when the Device is using the interface and Down when the Device is not using the interface. For the LAN interface, this field displays Up when the Device is using the interface and Down when the Device is not using the interface. For the WLAN interface, it displays Active when WLAN is enabled or InActive when WLAN is disabled. Rate For the 3G interface, it displays Enabled when 3G is enabled or Disabled when 3G is disabled. For the LAN interface, this displays the port speed and duplex setting. For the WAN interface, this displays the port speed and duplex setting. For the DSL interface, it displays the downstream and upstream transmission rate. For the WLAN interface, it displays the maximum transmission rate when WLAN is enabled or N/A when WLAN is disabled. System Status DSL Up Time System Up Time Current Date/Time System Resource CPU Usage Memory Usage USB Status Type Status Registration Status Account For the 3G interface, it displays the maximum transmission rate when 3G is enabled or N/A when 3G is disabled. This field displays how long the DSL connection has been active. This field displays how long the Device has been running since it last started up. The Device starts up when you plug it in, when you restart it (Maintenance > Reboot), or when you reset it (see Section 1.7 on page 26). This field displays the current date and time in the Device. You can change this in Maintenance > Time Setting. This field displays what percentage of the Device's processing ability is currently used. When this percentage is close to 100%, the Device is running at full load, and the throughput is not going to improve anymore. If you want some applications to have more throughput, you should turn off other applications. This field displays what percentage of the Device's memory is currently used. Usually, this percentage should not increase much. If memory usage does get close to 100%, the Device is probably becoming unstable, and you should restart the device. See Chapter 25 on page 267, or turn off the device (unplug the power) for a few seconds. This shows the type of device connected to the Device. This shows whether the device is currently active (Up). This shows N/A if there are no device connected to the Device or the connected device is not working. This column displays each SIP account in the Device. P-2812HNU(L)-Fx Series User's Guide 85
-
 1
1 -
2
-
3
-
4
-
5
-
6
-
7
-
8
-
9
-
10
-
11
-
12
-
13
-
14
-
15
-
16
-
17
-
18
-
19
-
20
-
21
-
22
-
23
-
24
-
25
-
26
-
27
-
28
-
29
-
30
-
31
-
32
-
33
-
34
-
35
-
36
-
37
-
38
-
39
-
40
-
41
-
42
-
43
-
44
-
45
-
46
-
47
-
48
-
49
-
50
-
51
-
52
-
53
-
54
-
55
-
56
-
57
-
58
-
59
-
60
-
61
-
62
-
63
-
64
-
65
-
66
-
67
-
68
-
69
-
70
-
71
-
72
-
73
-
74
-
75
-
76
-
77
-
78
-
79
-
 80
80 -
 81
81 -
 82
82 -
 83
83 -
 84
84 -
 85
85 -
 86
86 -
 87
87 -
 88
88 -
 89
89 -
 90
90 -
91
-
92
-
93
-
94
-
95
-
96
-
97
-
98
-
99
-
100
-
101
-
102
-
103
-
104
-
105
-
106
-
107
-
108
-
109
-
110
-
111
-
112
-
113
-
114
-
115
-
116
-
117
-
118
-
119
-
120
-
121
-
122
-
123
-
124
-
125
-
126
-
127
-
128
-
129
-
130
-
131
-
132
-
133
-
134
-
135
-
136
-
137
-
138
-
139
-
140
-
141
-
142
-
143
-
144
-
145
-
146
-
147
-
148
-
149
-
150
-
151
-
152
-
153
-
154
-
155
-
156
-
157
-
158
-
159
-
160
-
161
-
162
-
163
-
164
-
165
-
166
-
167
-
168
-
169
-
170
-
171
-
172
-
173
-
174
-
175
-
176
-
177
-
178
-
179
-
180
-
181
-
182
-
183
-
184
-
185
-
186
-
187
-
188
-
189
-
190
-
191
-
192
-
193
-
194
-
195
-
196
-
197
-
198
-
199
-
200
-
201
-
202
-
203
-
204
-
205
-
206
-
207
-
208
-
209
-
210
-
211
-
212
-
213
-
214
-
215
-
216
-
217
-
218
-
219
-
220
-
221
-
222
-
223
-
224
-
225
-
226
-
227
-
228
-
229
-
230
-
231
-
232
-
233
-
234
-
235
-
236
-
237
-
238
-
239
-
240
-
241
-
242
-
243
-
244
-
245
-
246
-
247
-
248
-
249
-
250
-
251
-
252
-
253
-
254
-
255
-
256
-
257
-
258
-
259
-
260
-
261
-
262
-
263
-
264
-
265
-
266
-
267
-
268
-
269
-
270
-
271
-
272
-
273
-
274
-
275
-
276
-
277
-
278
-
279
-
280
-
281
-
282
-
283
-
284
-
285
-
286
-
287
-
288
-
289
-
290
-
291
-
292
-
293
-
294
-
295
-
296
-
297
-
298
-
299
-
300
-
301
-
302
-
303
-
304
-
305
-
306
-
307
-
308
-
309
-
310
-
311
-
312
-
313
-
314
-
315
-
316
-
317
-
318
-
319
-
320
-
321
-
322
-
323
-
324
-
325
-
326
-
327
-
328
-
329
-
330
-
331
-
332
-
333
-
334
-
335
-
336
-
337
-
338
-
339
-
340
-
341
-
342
-
343
-
344
-
345
-
346
-
347
-
348
-
349
-
350
-
351
-
352
-
353
-
354
-
355
-
356
-
357
-
358
-
359
-
360
-
361
-
362
-
363
-
364
-
365
-
366
-
367
-
368
-
369
-
370
-
371
-
372
-
373
-
374
-
375
-
376
-
377
-
378
-
379
-
380
-
381
-
382
-
383
-
384
-
385
-
386
-
387
-
388
-
389
-
390
-
391
-
392
-
393
-
394
-
395
-
396
-
397
-
398
-
399
-
400
-
401
-
402
-
403
-
404
-
405
-
406
-
407
-
408
-
409
-
410
-
411
-
412
-
413
-
414
-
415
-
416
-
417
-
418
-
419
-
420
-
421
-
422
 |
 |