Casio fx 991MS User Guide - Page 32
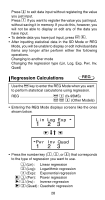
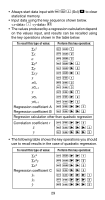
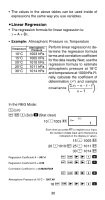
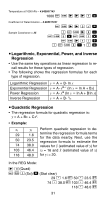
Linear Regression
 |
UPC - 079767134860
View all Casio fx 991MS manuals
Add to My Manuals
Save this manual to your list of manuals |
Page 32 highlights
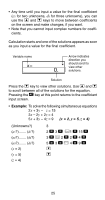
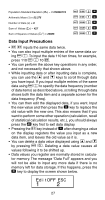
• The values in the above tables can be used inside of expressions the same way you use variables. u Linear Regression • The regression formula for linear regression is: y = A + Bx. • Example: Atmospheric Pressure vs. Temperature Temperature 10°C 15°C 20°C 25°C 30°C Atmospheric Pressure 1003 hPa 1005 hPa 1010 hPa 1011 hPa 1014 hPa Perform linear regression to determine the regression formula terms and correlation coefficient for the data nearby. Next, use the regression formula to estimate atmospheric pressure at 18°C and temperature at 1000 hPa. Finally, calculate the coefficient of determination (r2) and sample covariance . In the REG Mode: 1(Lin) A B 1 (Scl) = (Stat clear) REG 10 P1003 S n= 1. Each time you press S to register your input, the number of data input up to that point is indicated on the display (n value). 15 P 1005 S 20 P1010 S 25 P 1011 S 30 P 1014 S Regression Coefficient A = 997.4 A X r r 1 = Regression Coefficient B = 0.56 A X r r 2 = Correlation Coefficient r = 0.982607368 A X r r 3 = Atmospheric Pressure at 18°C = 1007.48 18 A X r r r 2 = 30
-
 1
1 -
2
-
3
-
4
-
5
-
6
-
7
-
8
-
9
-
10
-
11
-
12
-
13
-
14
-
15
-
16
-
17
-
18
-
19
-
20
-
21
-
22
-
23
-
24
-
25
-
26
-
 27
27 -
 28
28 -
 29
29 -
 30
30 -
 31
31 -
 32
32 -
 33
33 -
 34
34 -
 35
35 -
 36
36 -
 37
37 -
38
-
39
-
40
-
41
-
42
 |
 |
