Fluke 345 FE PowerLog Users Manual - Page 21
Screens Tab, In the example in the power logger in use was the Fluke 1735, and
 |
View all Fluke 345 manuals
Add to My Manuals
Save this manual to your list of manuals |
Page 21 highlights
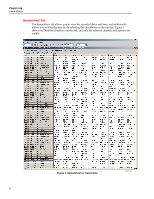
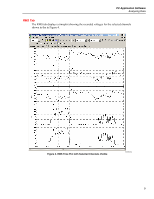
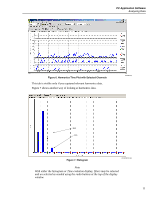
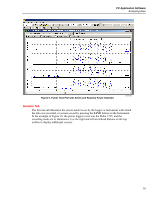
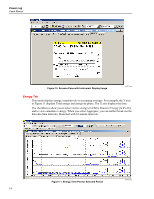
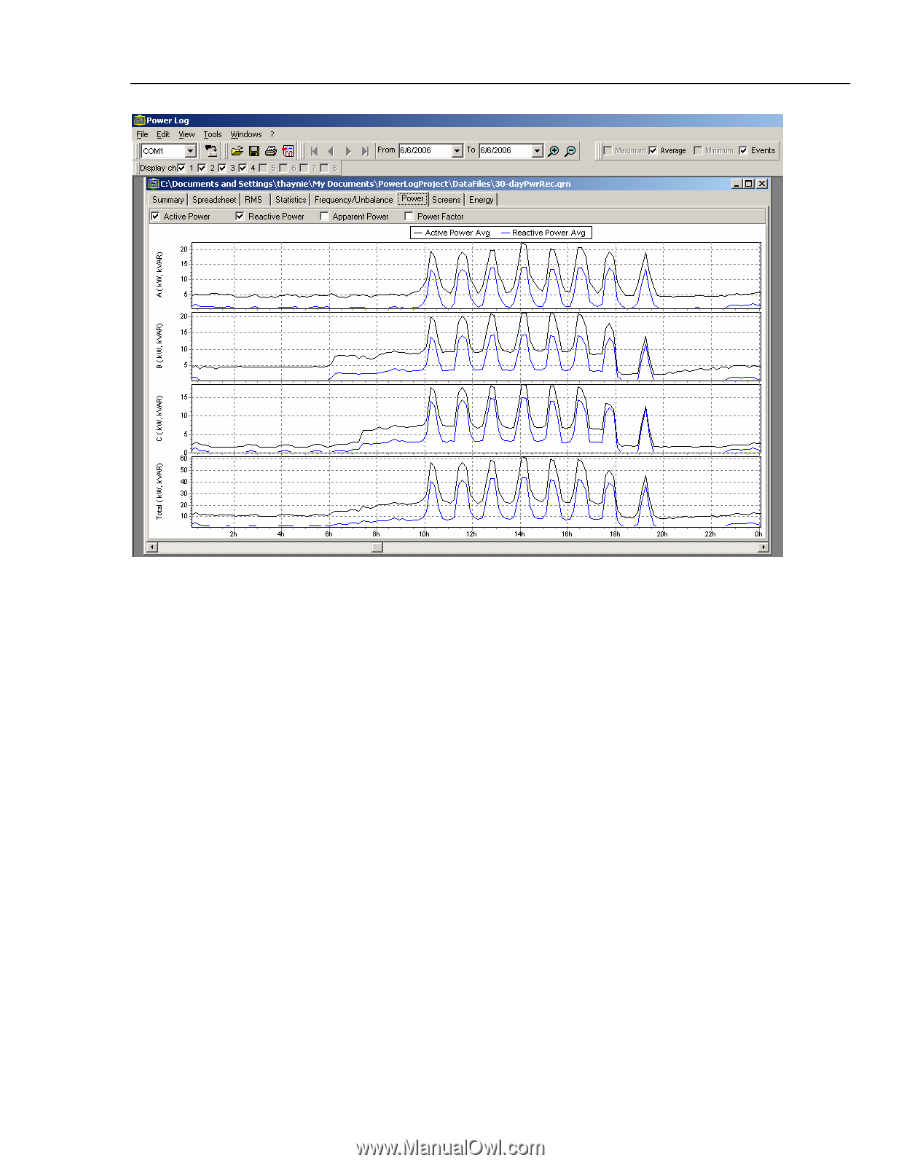
PC Application Software Analyzing Data Figure 9. Power Time Plot with Active and Reactive Power Selected eto010.bmp Screens Tab The Screens tab illustrates the screen mode in use by the logger or instrument with which the data was recorded, or screens saved by pressing the SAVE button on the Instrument. In the example in Figure 10, the power logger in use was the Fluke 1735, and the recording mode set to Harmonics. Use the right and left arrowhead buttons on the top toolbar to display additional screens. 13
-
 1
1 -
2
-
3
-
4
-
5
-
6
-
7
-
8
-
9
-
10
-
11
-
12
-
13
-
14
-
15
-
 16
16 -
 17
17 -
 18
18 -
 19
19 -
 20
20 -
 21
21 -
 22
22 -
 23
23 -
 24
24 -
 25
25 -
 26
26
 |
 |
PC Application Software
Analyzing Data
13
eto010.bmp
Figure 9. Power Time Plot with Active and Reactive Power Selected
Screens Tab
The Screens tab illustrates the screen mode in use by the logger or instrument with which
the data was recorded, or screens saved by pressing the
SAVE
button on the Instrument.
In the example in Figure 10, the power logger in use was the Fluke 1735, and the
recording mode set to Harmonics. Use the right and left arrowhead buttons on the top
toolbar to display additional screens.