Garmin 010-10319-00 Blue Chart User's Guide - Page 17
To focus on the details of only one chart at a time, are light sectors
 |
UPC - 753759036034
View all Garmin 010-10319-00 manuals
Add to My Manuals
Save this manual to your list of manuals |
Page 17 highlights
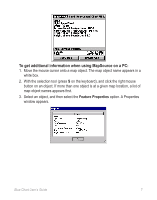
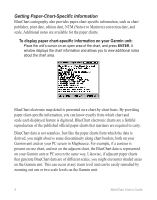
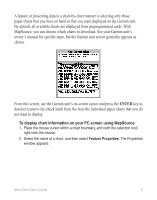
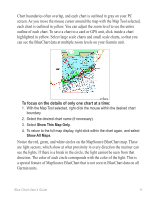
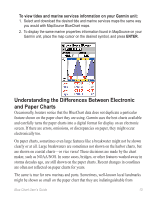
Chart boundaries often overlap, and each chart is outlined in gray on your PC screen. As you move the mouse cursor around the map with the Map Tool selected, each chart is outlined in yellow. You can adjust the zoom level to see the entire outline of each chart. To save a chart to a card or GPS unit, click inside a chart highlighted in yellow. Select large scale charts and small scale charts, so that you can see the BlueChart data at multiple zoom levels on your Garmin unit. To focus on the details of only one chart at a time: 1. With the Map Tool selected, right-click the mouse within the desired chart boundary. 2. Select the desired chart name (if necessary). 3. Select Show This Map Only. 4. To return to the full map display, right-click within the chart again, and select Show All Maps. Notice the red, green, and white circles on the MapSource BlueChart map. These are light sectors, which show at what proximity in every direction the mariner can see the lights. If there is a break in the circle, the light cannot be seen from that direction. The color of each circle corresponds with the color of the light. This is a special feature of MapSource BlueChart that is not seen in BlueChart data on all Garmin units. Blue Chart User's Guide 11
-
 1
1 -
2
-
3
-
4
-
5
-
6
-
7
-
8
-
9
-
10
-
11
-
 12
12 -
 13
13 -
 14
14 -
 15
15 -
 16
16 -
 17
17 -
 18
18 -
 19
19 -
 20
20 -
 21
21 -
 22
22 -
23
-
24
-
25
-
26
-
27
-
28
 |
 |
