HP 9g hp 9g_user's manual_English_E_HDP1SG18ES1.pdf - Page 24
BaseN Calculations
 |
View all HP 9g manuals
Add to My Manuals
Save this manual to your list of manuals |
Page 24 highlights
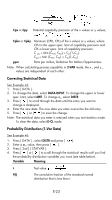
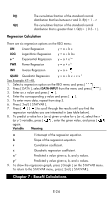
R(t) The cumulative fraction of the standard normal distribution that lies between t and 0. R(t) = 1 - t. Q(t) The cumulative fraction of the standard normal distribution that is greater than t. Q(t) = | 0.5- t |. Regression Calculation There are six regression options on the REG menu: LIN Linear Regression y = a + b x LOG Logarithmic Regression y = a + b lnx e ^ Exponential Regression y = a • e bx PWR Power Regression y = a • x b INV Inverse Regression y = a + QUAD Quadratic Regression y = a + b x + c x 2 See Example 47~48. 1. Select a regression option on the REG menu and press [ ] . 2. Press [ DATA ], select DATA-INPUT from the menu and press [ ]. 3. Enter an x value and press [ ]. 4. Enter the corresponding y value and press [ ]. 5. To enter more data, repeat from step 3. 6. Press [ 2nd ] [ STATVAR ]. 7. Press [ ] [ ] to scroll through the results until you find the regression variables you are interested in (see table below). 8. To predict a value for x (or y) given a value for y (or x), select the x ' (or y ') variable, press [ ] , enter the given value, and press [ ] again. Variable Meaning a Y-intercept of the regression equation. b Slope of the regression equation. r Correlation coefficient. c Quadratic regression coefficient. x ' Predicted x value given a, b, and y values. y ' Predicted y value given a, b, and x values. 9. To draw the regression graph, press [ Graph ] on the STATVAR menu. To return to the STATVAR menu, press [ 2nd ] [ STATVAR ]. Chapter 7 : BaseN Calculations E-24
-
 1
1 -
2
-
3
-
4
-
5
-
6
-
7
-
8
-
9
-
10
-
11
-
12
-
13
-
14
-
15
-
16
-
17
-
18
-
 19
19 -
 20
20 -
 21
21 -
 22
22 -
 23
23 -
 24
24 -
 25
25 -
 26
26 -
 27
27 -
 28
28 -
 29
29 -
30
-
31
-
32
-
33
-
34
-
35
-
36
-
37
-
38
-
39
-
40
-
41
-
42
-
43
-
44
-
45
-
46
-
47
-
48
-
49
-
50
-
51
-
52
-
53
-
54
-
55
-
56
-
57
-
58
-
59
-
60
-
61
-
62
-
63
-
64
-
65
-
66
-
67
-
68
-
69
-
70
-
71
-
72
-
73
-
74
-
75
-
76
-
77
-
78
-
79
-
80
-
81
-
82
-
83
-
84
-
85
-
86
-
87
 |
 |
