HP P Class 450/500/550/600/650/700/750 hp visualize workstation - Graphics for - Page 5
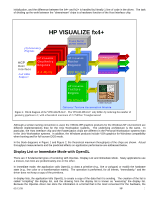
Performance Characteristics of the VISUALIZE fx+ Family
 |
View all HP P Class 450/500/550/600/650/700/750 manuals
Add to My Manuals
Save this manual to your list of manuals |
Page 5 highlights
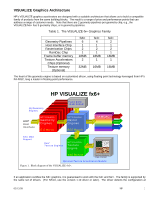
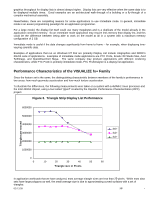
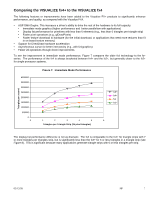
graphics throughput for display lists is almost always higher. Display lists are very effective when the same data is to be displayed multiple times. Good examples are an architectural walk-through of a building or a fly-through of a complex mechanical assembly. Nevertheless, there are compelling reasons for some applications to use immediate mode. In general, immediate mode is an easier programming paradigm for an application programmer. For a large model, the display list itself could use many megabytes and is a duplicate of the model already in the application controlled memory. So an immediate mode application may require less memory than display list, and this could be the difference between being able to work on the model at all in a system with a maximum memory configuration of 2 GB. Immediate mode is useful if the data changes significantly from frame to frame - for example, when displaying timevarying scientific data. Examples of applications that run on Windows NT that are primarily Display List include Unigraphics and SDRC's IDEAS suite of applications. Examples of immediate mode applications are PTC Pro/E, Kinetix 3D Studio Max, Avid SoftImage, and Alias/Wavefront Maya. The same company may produce applications with different rendering characteristics: while PTC Pro/E is primarily immediate mode, PTC Pro/Designer is a display list application. Performance Characteristics of the VISUALIZE fx+ Family Since the feature set is the same, the distinguishing characteristic between members of the family is performance in two areas: how much geometry acceleration and how much texture acceleration. To illustrate the differences, the following measurements were taken on a system with a 450MHz Xeon processor and the Intel 440GX chipset, using a tool called "glperf" created by the OpenGL Performance Characterization (OPC) project. Figure 3. Triangle Strip Display List Performance Triangles per second 6000000 5000000 4000000 fx6+ 3000000 fx4+ fx2+ 2000000 1000000 0 0 10 20 30 40 50 60 Triangle size in Pixels In application workloads that we have analyzed, most average triangle sizes are less than 25-pixels. While most data sets have large polygons as well, the small average size is due to approximating curved surfaces with a set of triangles. 03/12/99 HP 4
-
 1
1 -
 2
2 -
 3
3 -
 4
4 -
 5
5 -
 6
6 -
 7
7 -
 8
8 -
 9
9 -
 10
10
 |
 |