HP StorageWorks 2/32 Brocade Fabric Watch Administrator's Guide - Supporting F - Page 76
Port detail report, Example: Switch status policy report, Example: Port detail report
 |
View all HP StorageWorks 2/32 manuals
Add to My Manuals
Save this manual to your list of manuals |
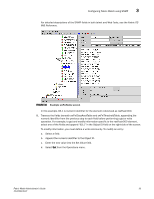
Page 76 highlights
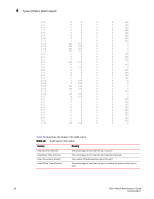
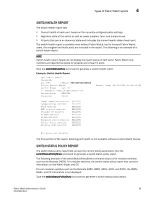
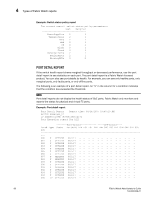
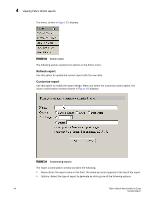
4 Types of Fabric Watch reports Example: Switch status policy report The current overall switch status policy parameters: Down Marginal PowerSupplies 2 1 Temperatures 2 1 Fans 2 1 WWN 0 1 CP 0 1 Blade 0 1 Flash 0 1 MarginalPorts 2 1 FaultyPorts 2 1 MissingSFPs 0 0 PORT DETAIL REPORT If the switch health report shows marginal throughput or decreased performance, use the port detail report to see statistics on each port. The port detail report is a Fabric Watch licensed product. You can also see port details by health. For example, you can see only healthy ports, only marginal ports, only faulty ports, or only offline ports. The following is an example of a port detail report. An "X" in the column for a condition indicates that the condition has exceeded the threshold. NOTE Port detail reports do not display the health status of GbE ports. Fabric Watch only monitors and reports the status for physical and virtual FC ports. Example: Port detail report Port Detail Report Report time: 04/24/2007 03:40:10 AM Switch Name:geo_hi IP address:1080::8:800:200C:417A Port Exception report [by All] --------Port-Errors SFP-Errors---Port# Type State Dur(H:M) LFA LSY LSI PER INW CRC PSC BLP STM SRX STX SCU SVO 080 U OFFLINE 062:17 081 U OFFLINE 062:17 082 U OFFLINE 062:17 083 U OFFLINE 062:17 084 U OFFLINE 062:17 085 U OFFLINE 062:17 086 U OFFLINE 062:17 087 F HEALTHY 062:17 088 F HEALTHY 062:17 089 U OFFLINE 062:17 090 U OFFLINE 062:17 091 U OFFLINE 062:17 092 U OFFLINE 062:17 093 U OFFLINE 062:17 094 U OFFLINE 062:17 095 DP OFFLINE 062:17 60 Fabric Watch Administrator's Guide 53-0000438-01
-
 1
1 -
2
-
3
-
4
-
5
-
6
-
7
-
8
-
9
-
10
-
11
-
12
-
13
-
14
-
15
-
16
-
17
-
18
-
19
-
20
-
21
-
22
-
23
-
24
-
25
-
26
-
27
-
28
-
29
-
30
-
31
-
32
-
33
-
34
-
35
-
36
-
37
-
38
-
39
-
40
-
41
-
42
-
43
-
44
-
45
-
46
-
47
-
48
-
49
-
50
-
51
-
52
-
53
-
54
-
55
-
56
-
57
-
58
-
59
-
60
-
61
-
62
-
63
-
64
-
65
-
66
-
67
-
68
-
69
-
70
-
 71
71 -
 72
72 -
 73
73 -
 74
74 -
 75
75 -
 76
76 -
 77
77 -
 78
78 -
 79
79 -
 80
80 -
 81
81 -
82
-
83
-
84
-
85
-
86
-
87
-
88
-
89
-
90
-
91
-
92
-
93
-
94
-
95
-
96
-
97
-
98
-
99
-
100
-
101
-
102
 |
 |