HP hp39gPlus User Guide - Page 25
Trig Explorer aplet
 |
UPC - 829160013138
View all HP hp39gPlus manuals
Add to My Manuals
Save this manual to your list of manuals |
Page 25 highlights
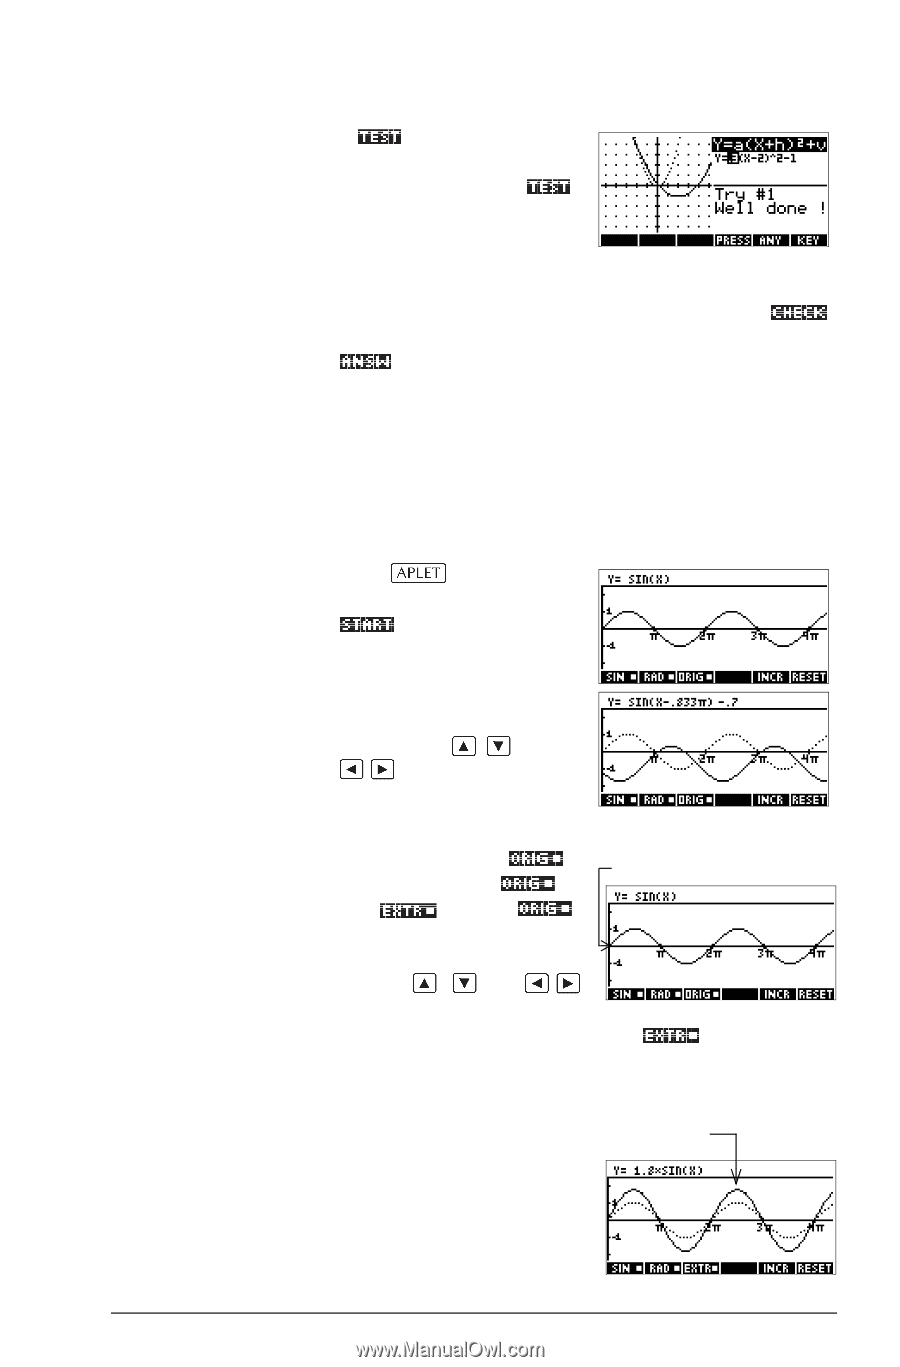
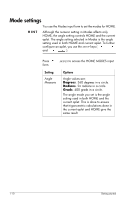
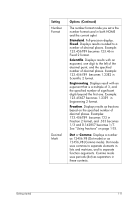
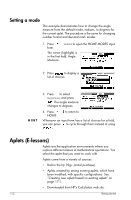
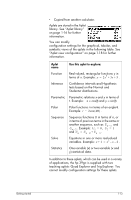
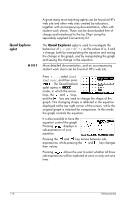
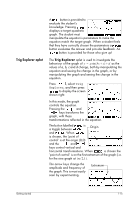
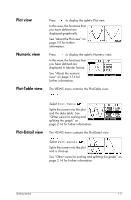
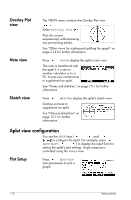
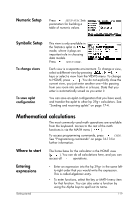
Trig Explorer aplet A button is provided to evaluate the student's knowledge. Pressing displays a target quadratic graph. The student must manipulate the equation's parameters to make the equation match the target graph. When a student feels that they have correctly chosen the parameters a button evaluates the answer and provide feedback. An button is provided for those who give up! The Trig Explorer aplet is used to investigate the behaviour of the graph of y = a sin(bx + c) + d as the values of a, b, c and d change, both by manipulating the equation and seeing the change in the graph, or by manipulating the graph and seeing the change in the equation. Press , select Trig Explorer, and then press to display the screen shown right. In this mode, the graph controls the equation. Pressing the and keys transforms the graph, with these transformations reflected in the equation. The button labelled a toggle between is Origin and . When is chosen, the 'point of control' is at the origin (0,0) and the and keys control vertical and horizontal transformations. When is chosen the 'point of control' is on the first extremum of the graph (i.e. for the sine graph at (π ⁄ 2,1) . The arrow keys change the amplitude and frequency of the graph. This is most easily seen by experimenting. Extremum Getting started 1-15
-
 1
1 -
2
-
3
-
4
-
5
-
6
-
7
-
8
-
9
-
10
-
11
-
12
-
13
-
14
-
15
-
16
-
17
-
18
-
19
-
 20
20 -
 21
21 -
 22
22 -
 23
23 -
 24
24 -
 25
25 -
 26
26 -
 27
27 -
 28
28 -
 29
29 -
 30
30 -
31
-
32
-
33
-
34
-
35
-
36
-
37
-
38
-
39
-
40
-
41
-
42
-
43
-
44
-
45
-
46
-
47
-
48
-
49
-
50
-
51
-
52
-
53
-
54
-
55
-
56
-
57
-
58
-
59
-
60
-
61
-
62
-
63
-
64
-
65
-
66
-
67
-
68
-
69
-
70
-
71
-
72
-
73
-
74
-
75
-
76
-
77
-
78
-
79
-
80
-
81
-
82
-
83
-
84
-
85
-
86
-
87
-
88
-
89
-
90
-
91
-
92
-
93
-
94
-
95
-
96
-
97
-
98
-
99
-
100
-
101
-
102
-
103
-
104
-
105
-
106
-
107
-
108
-
109
-
110
-
111
-
112
-
113
-
114
-
115
-
116
-
117
-
118
-
119
-
120
-
121
-
122
-
123
-
124
-
125
-
126
-
127
-
128
-
129
-
130
-
131
-
132
-
133
-
134
-
135
-
136
-
137
-
138
-
139
-
140
-
141
-
142
-
143
-
144
-
145
-
146
-
147
-
148
-
149
-
150
-
151
-
152
-
153
-
154
-
155
-
156
-
157
-
158
-
159
-
160
-
161
-
162
-
163
-
164
-
165
-
166
-
167
-
168
-
169
-
170
-
171
-
172
-
173
-
174
-
175
-
176
-
177
-
178
-
179
-
180
-
181
-
182
-
183
-
184
-
185
-
186
-
187
-
188
-
189
-
190
-
191
-
192
-
193
-
194
-
195
-
196
-
197
-
198
-
199
-
200
-
201
-
202
-
203
-
204
-
205
-
206
-
207
-
208
-
209
-
210
-
211
-
212
-
213
-
214
-
215
-
216
-
217
-
218
-
219
-
220
-
221
-
222
-
223
-
224
-
225
-
226
-
227
-
228
-
229
-
230
-
231
-
232
-
233
-
234
-
235
-
236
-
237
-
238
-
239
-
240
-
241
-
242
-
243
-
244
-
245
-
246
-
247
-
248
-
249
-
250
-
251
-
252
-
253
-
254
-
255
-
256
-
257
-
258
-
259
-
260
-
261
-
262
-
263
-
264
-
265
-
266
-
267
-
268
-
269
-
270
-
271
-
272
-
273
-
274
-
275
-
276
-
277
-
278
-
279
-
280
-
281
-
282
-
283
-
284
-
285
-
286
-
287
-
288
-
289
-
290
-
291
-
292
-
293
-
294
 |
 |