HP t5710 HP Sygate Security Agent User Guide - Page 41
Agent: Blocked or Allowed
 |
View all HP t5710 manuals
Add to My Manuals
Save this manual to your list of manuals |
Page 41 highlights
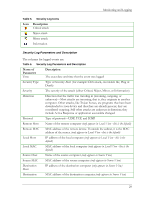
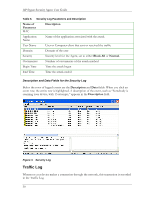
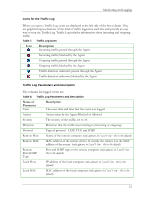
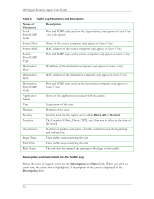
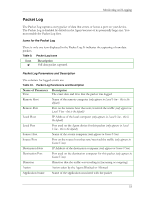
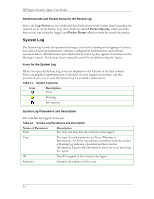
Monitoring and Logging Icons for the Traffic Log When you open a Traffic Log, icons are displayed at the left side of the first column. They are graphical representations of the kind of traffic logged on each line and provide an easy way to scan the Traffic Log. Traffic Log includes information about incoming and outgoing traffic. Table 7. Traffic Log Icons Icon Description Incoming traffic; passed through the Agent Incoming traffic; blocked by the Agent Outgoing traffic; passed through the Agent Outgoing traffic; blocked by the Agent Traffic direction unknown; passed through the Agent Traffic direction unknown; blocked by the Agent Traffic Log Parameters and Description The columns for logged events are: Table 8. Traffic Log Parameters and Description Name of Parameter Time Description The exact date and time that the event was logged Action Action taken by the Agent: Blocked or Allowed Severity The severity of the traffic, set to 10. Direction Direction that the traffic was traveling in (incoming or outgoing) Protocol Type of protocol - UDP, TCP, and ICMP Remote Host Name of the remote computer (only appears in Local View - this is the default) Remote MAC MAC address of the remote device. If outside the subnet, it is the MAC address of the router. (only appears in Local View - this is the default) Remote Port/ICMP Type Port and ICMP type on the remote computer (only appears in Local View this is the default) Local Host IP address of the local computer (only appears in Local View - this is the default) Local MAC MAC address of the local computer (only appears in Local View - this is the default) 31
-
 1
1 -
2
-
3
-
4
-
5
-
6
-
7
-
8
-
9
-
10
-
11
-
12
-
13
-
14
-
15
-
16
-
17
-
18
-
19
-
20
-
21
-
22
-
23
-
24
-
25
-
26
-
27
-
28
-
29
-
30
-
31
-
32
-
33
-
34
-
35
-
 36
36 -
 37
37 -
 38
38 -
 39
39 -
 40
40 -
 41
41 -
 42
42 -
 43
43 -
 44
44 -
 45
45 -
 46
46 -
47
-
48
-
49
-
50
-
51
-
52
-
53
-
54
-
55
-
56
-
57
-
58
-
59
-
60
-
61
-
62
-
63
-
64
-
65
-
66
-
67
-
68
-
69
-
70
-
71
-
72
-
73
-
74
-
75
-
76
 |
 |
