Samsung MultiXpress SCX-8123 Fleet Admin Pro Overview Admin Guide - Page 13

Dashboard, Domain, Server

Page 13 highlights

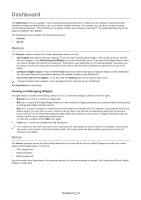
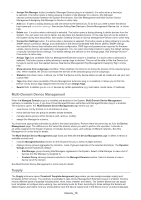
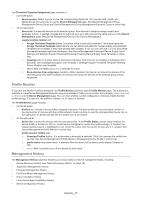
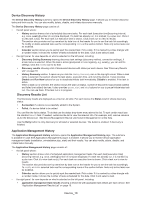
Dashboard The Dashboard menu is available, if you have Dashboard permission(s). It allows you to configure a dashboard with interactive widgets showing device, user, and System related statistics. For example, you can add a widget showing current status of devices. This will help you to quickly monitor your printing environment. The widget set depends on the plug-ins installed in the System. The Dashboard menu includes the following submenus: • Domain, • Server. Domain The Domain submenu opens the Domain dashboard where you can: • add widgets with device and user statistics. To do this click a widget place-holder in the top left corner (to add the very first widget) or the Add Dashboard Widget icon at the bottom left corner. They open the Widget Wizard where you select a widget and specify its parameters. Parameters vary depending on the selected widget. Generally, you will select a device/user group whose statistics you wish to tack and how to display the statistics (as a pie or bar chart). • configure widgets layout. From the View mode drop-down select how many widgets to display on the Dashboard. You can also drag and drop added widgets to the needed location on the Dashboard. • set refresh interval for widgets. To do this click the Setting button at the bottom right corner. If several domains are available, every managed domain will have its own dashboard. See Dashboard in online help. Viewing and Managing Widgets A widget header includes the following controls for you to view and manage it (listed from left to right): • Refresh icon. Click it to refresh a widget data. • Edit icon. It opens the Widget Wizard where you can modify the widget parameters (e.g. select another device group or change the widget statistics period). • Max icon. It opens a widget in a maximized view showing more detailed info. For example, if you expand the Device Status widget, you can view not only a device chart by status, but also the corresponding device list as well as a link (on the left ) to the Device Management page where the full Device List is shown. A widget expanded view can include a link to the corresponding instant report. To minimize a widget click the Max icon again. • Close icon. It removes a widget from the Dashboard. For a chart you can hover the cursor over a bar/sector to view details on what it shows. For example, as you hover the cursor over a sector of the Device Status chart, the tooltip shows the device status, percent and number of devices in this status. Server The Server submenu opens the Sever dashboard where you can add the Server Health Widget to monitor the current status of the System server in terms of: • CPU usage level, • RAM availability, • HDD usage level. Use the header icons (described in the previous section) to view and manage the widget. See Dashboard>Server Health Widget in online help. Dashboard_13

  • 1
  • 2
  • 3
  • 4
  • 5
  • 6
  • 7
  • 8
  • 9
  • 10
  • 11
  • 12
  • 13
  • 14
  • 15
  • 16
  • 17
  • 18
  • 19
  • 20
  • 21
  • 22
  • 23
  • 24
  • 25
  • 26
  • 27
  • 28
  • 29
  • 30
  • 31
  • 32
  • 33
  • 34
  • 35
  • 36
  • 37
  • 38
  • 39
  • 40
  • 41
  • 42
  • 43
  • 44
  • 45
  • 46
  • 47
  • 48
  • 49
  • 50
  • 51
  • 52
  • 53
  • 54
  • 55
  • 56
  • 57
  • 58
  • 59
  • 60
  • 61
  • 62
  • 63
  • 64
  • 65

Dashboard_13
Dashboard
The
Dashboard
menu is available, if you have
Dashboard permission(s)
. It allows you to configure a dashboard with
interactive widgets showing device, user, and System related statistics. For example, you can add a widget showing
current status of devices. This will help you to quickly monitor your printing environment. The widget set depends on the
plug-ins installed in the System.
The Dashboard menu includes the following submenus:
Domain
,
Server
.
Domain
The
Domain
submenu opens the Domain dashboard where you can:
add widgets
with device and user statistics. To do this click a widget place-holder in the top left corner (to add the
very first widget) or the
Add Dashboard Widget
icon at the bottom left corner. They open the Widget Wizard where
you select a widget and specify its parameters. Parameters vary depending on the selected widget. Generally, you
will select a device/user group whose statistics you wish to tack and how to display the statistics (as a pie or bar
chart).
configure widgets layout
. From the
View mode
drop-down select how many widgets to display on the Dashboard.
You can also drag and drop added widgets to the needed location on the Dashboard.
set refresh interval for widgets
. To do this click the
Setting
button at the bottom right corner.
If several domains are available, every managed domain will have its own dashboard.
See
Dashboard
in online help.
Viewing and Managing Widgets
A widget header includes the following controls for you to view and manage it (listed from left to right):
Refresh
icon. Click it to refresh a widget data.
Edit
icon. It opens the Widget Wizard where you can modify the widget parameters (e.g. select another device group
or change the widget statistics period).
Max
icon. It opens a widget in a maximized view showing more detailed info. For example, if you expand the Device
Status widget, you can view not only a device chart by status, but also the corresponding device list as well as a
link (on the left ) to the Device Management page where the full Device List is shown. A widget expanded view can
include a link to the corresponding instant report.
To minimize a widget click the
Max
icon again.
Close
icon. It removes a widget from the Dashboard.
For a chart you can hover the cursor over a bar/sector to view details on what it shows. For example, as you hover
the cursor over a sector of the Device Status chart, the tooltip shows the device status, percent and number of
devices in this status.
Server
The
Server
submenu opens the Sever dashboard where you can add the Server Health Widget to monitor the current
status of the System server in terms of:
CPU usage level,
RAM availability,
HDD usage level.
Use the header icons (described in the previous section) to view and manage the widget. See Dashboard>Server Health
Widget in online help.