Apple M8889LL/A User Guide - Page 46
Monitoring Status Lights and Other Indicators on the Server, If the Server Has a Problem
 |
UPC - 718908456057
View all Apple M8889LL/A manuals
Add to My Manuals
Save this manual to your list of manuals |
Page 46 highlights
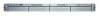
Monitoring Status Lights and Other Indicators on the Server The server has a number of built-in sensors that detect and report essential operating factors, such as power, temperature, and condition of several key components. You can monitor the server's operation using the lights on the unit or using the remote monitoring tools. The server's status lights are listed in the table below. Indicator Power Security lock System identifier Ethernet (lower is built-in port; upper is network card, if installed) System activity Drive module (upper LED) Drive module (lower LED) Color White Yellow Yellow Green No light Blue Green Yellow Red No light Blinking blue Description On and OK Lock is engaged Indicates that there is a hardware error in the server or that someone has turned on the light manually; check the server monitoring application for more information. Link No connection Two rows of eight LEDs; in server with one processor, rows of lights work in tandem; in dual-processor server, rows operate independently for each processor Powered and running Warning condition Problem or failure Drive module can be removed Disk activity; do not remove drive module If the Server Has a Problem If you discover a problem with the server, you can assess the situation and often solve the problem from a remote computer. The Mac OS X Server software documentation contains information about restarting the server and solving some other problems; see the Quick Start for Xserve booklet to learn which parts of the software documentation to consult. 46 Chapter 4
-
 1
1 -
2
-
3
-
4
-
5
-
6
-
7
-
8
-
9
-
10
-
11
-
12
-
13
-
14
-
15
-
16
-
17
-
18
-
19
-
20
-
21
-
22
-
23
-
24
-
25
-
26
-
27
-
28
-
29
-
30
-
31
-
32
-
33
-
34
-
35
-
36
-
37
-
38
-
39
-
40
-
 41
41 -
 42
42 -
 43
43 -
 44
44 -
 45
45 -
 46
46 -
 47
47 -
 48
48 -
 49
49 -
 50
50 -
 51
51 -
52
-
53
-
54
-
55
-
56
-
57
-
58
-
59
-
60
-
61
-
62
-
63
-
64
-
65
-
66
-
67
-
68
-
69
-
70
-
71
-
72
-
73
-
74
-
75
-
76
-
77
-
78
 |
 |
