Canon 1234B002 Digital Photo Professional Instruction Manual Windows (EOS 30D) - Page 44
Adjusting the Tone Curve
 |
UPC - 013803065107
View all Canon 1234B002 manuals
Add to My Manuals
Save this manual to your list of manuals |
Page 44 highlights
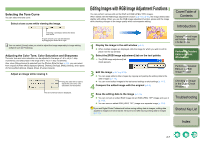
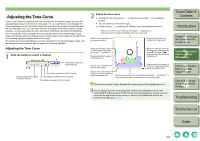
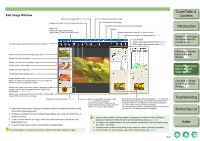
Adjusting the Tone Curve A tone curve shows the brightness and color saturation for the original image (input) and the adjusted image (output) in the form of a line graph. You can use the tone curve to adjust the image brightness and color saturation values that were set by the camera automatically when the shot was taken. Also, you can adjust the input and output of the entire image in a single operation, or individually adjust the input and output of [R] (Red), [G] (Green) and [B] (Blue). The horizontal axis shows the brightness and color saturation for the original image (input) image, with the left-hand end indicating shadow (darker areas of the image) and the right-hand end indicating highlights (brighter areas of the image). The vertical axis shows the brightness and color saturation for the adjusted image (output), with the lower end indicating shadow and the upper end indicating highlights. Adjusting the Tone Curve 1 Click the button to select a channel. Restores the image to its original settings. The settings are applied to the B channel. The same settings are applied The settings are applied to the G channel. to all RGB channels. The settings are applied to the R channel. 2 Adjust the tone curve. O Clicking the tone curve shows [ ] on the tone curve. Drag [ ] to your desired location. O You can specify up to 8 points of [ ]. O Double-clicking [ ] or pressing the key on the keyboard deletes it. When you move the cursor to the top of the graph, [ ] changes to [ ]. Drag it downward to adjust the highlight point in the output side. Enter a value to specify the maximum output. Horizontal axis: Input level Vertical axis: Output level When you move the cursor to the left edge of the graph, the cursor [ ] changes to [ ]. Drag the slider right to adjust the shadow point. When you move the cursor to the right edge of the graph, the cursor [ ] changes to [ ]. Drag the slider left to adjust the highlight point. Enter a value to specify the minimum output. Enter a value in the range of 8 to 255 (in 1-stop increments) to adjust the highlight point. Enter a value in the range of 0 to 247 (in 1-stop increments) to adjust the shadow point. When you move the cursor to the bottom of the graph, [ ] changes to [ ]. Drag it upward to adjust the shadow point in the output side. The minimum number of steps between the shadow point and the highlight point is 8. You can change the tone curve interpolation method (Curve/Straight) or tone curve modes (RGB R G B/Luminance R G B) from the menu that appears by clicking on a tone curve with the right button on the mouse, or from the [Tool palette] tab sheet in the [Preferences] dialog box (p.1-26). Cover/Table of Contents Introduction 1 Displaying Thumbnail Images and Performing Basic Edits in the Main Window 2 Performing Detailed Edits in the Edit Window 3 Performing Detailed Edits in the Edit Image Window 4 Checking an Image in the Quick Check Window Troubleshooting Shortcut Key List Index 2-9
-
 1
1 -
2
-
3
-
4
-
5
-
6
-
7
-
8
-
9
-
10
-
11
-
12
-
13
-
14
-
15
-
16
-
17
-
18
-
19
-
20
-
21
-
22
-
23
-
24
-
25
-
26
-
27
-
28
-
29
-
30
-
31
-
32
-
33
-
34
-
35
-
36
-
37
-
38
-
 39
39 -
 40
40 -
 41
41 -
 42
42 -
 43
43 -
 44
44 -
 45
45 -
 46
46 -
 47
47 -
 48
48 -
 49
49 -
50
-
51
-
52
 |
 |
