Canon 1236B002 User Manual - Page 125
Histogram, Brightness] Display, RGB] Display
 |
View all Canon 1236B002 manuals
Add to My Manuals
Save this manual to your list of manuals |
Page 125 highlights
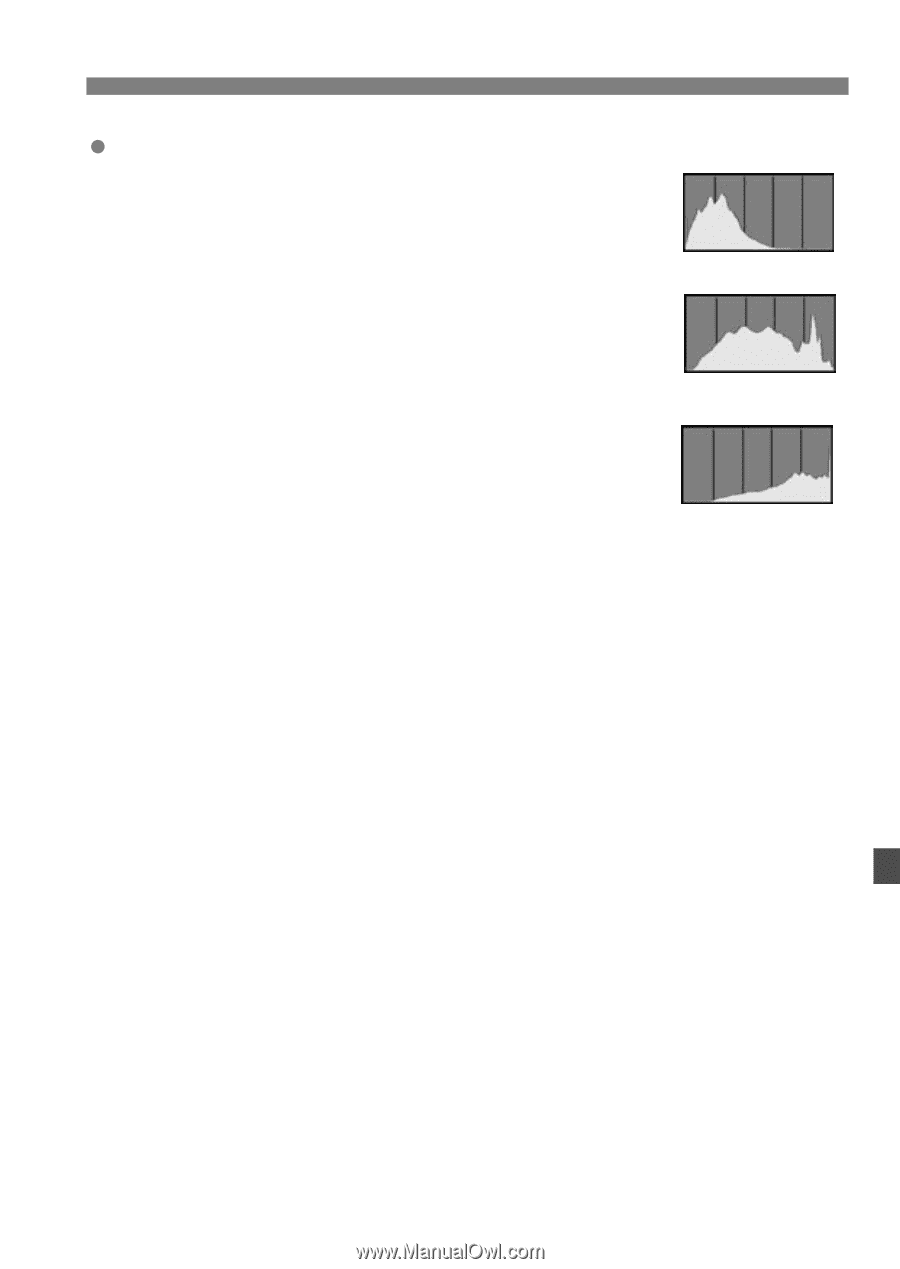
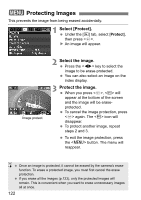
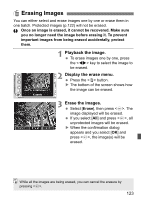
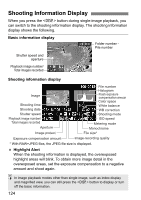
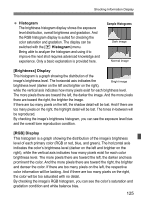
Shooting Information Display Histogram The brightness histogram display shows the exposure level distribution, overall brightness and gradation. And the RGB histogram display is suited for checking the color saturation and gradation. The display can be switched with the [x Histogram] menu. Being able to analyze the histogram and using it to improve the next shot requires advanced knowledge and experience. Only a basic explanation is provided here. Sample Histograms Dark image Normal image [Brightness] Display This histogram is a graph showing the distribution of the image's brightness level. The horizontal axis indicates the brightness level (darker on the left and brighter on the right), Bright image while the vertical axis indicates how many pixels exist for each brightness level. The more pixels there are toward the left, the darker the image. And the more pixels there are toward the right, the brighter the image. If there are too many pixels on the left, the shadow detail will be lost. And if there are too many pixels on the right, the highlight detail will be lost. The tones in-between will be reproduced. By checking the image's brightness histogram, you can see the exposure level bias and the overall tone reproduction condition. [RGB] Display This histogram is a graph showing the distribution of the image's brightness level of each primary color (RGB or red, blue, and green). The horizontal axis indicates the color's brightness level (darker on the left and brighter on the right), while the vertical axis indicates how many pixels exist for each color brightness level. The more pixels there are toward the left, the darker and less prominent the color. And the more pixels there are toward the right, the brighter and denser the color. If there are too many pixels on the left, the respective color information will be lacking. And if there are too many pixels on the right, the color will be too saturated with no detail. By checking the image's RGB histogram, you can see the color's saturation and gradation condition and white balance bias. 125
-
 1
1 -
2
-
3
-
4
-
5
-
6
-
7
-
8
-
9
-
10
-
11
-
12
-
13
-
14
-
15
-
16
-
17
-
18
-
19
-
20
-
21
-
22
-
23
-
24
-
25
-
26
-
27
-
28
-
29
-
30
-
31
-
32
-
33
-
34
-
35
-
36
-
37
-
38
-
39
-
40
-
41
-
42
-
43
-
44
-
45
-
46
-
47
-
48
-
49
-
50
-
51
-
52
-
53
-
54
-
55
-
56
-
57
-
58
-
59
-
60
-
61
-
62
-
63
-
64
-
65
-
66
-
67
-
68
-
69
-
70
-
71
-
72
-
73
-
74
-
75
-
76
-
77
-
78
-
79
-
80
-
81
-
82
-
83
-
84
-
85
-
86
-
87
-
88
-
89
-
90
-
91
-
92
-
93
-
94
-
95
-
96
-
97
-
98
-
99
-
100
-
101
-
102
-
103
-
104
-
105
-
106
-
107
-
108
-
109
-
110
-
111
-
112
-
113
-
114
-
115
-
116
-
117
-
118
-
119
-
 120
120 -
 121
121 -
 122
122 -
 123
123 -
 124
124 -
 125
125 -
 126
126 -
 127
127 -
 128
128 -
 129
129 -
 130
130 -
131
-
132
-
133
-
134
-
135
-
136
-
137
-
138
-
139
-
140
-
141
-
142
-
143
-
144
-
145
-
146
-
147
-
148
-
149
-
150
-
151
-
152
-
153
-
154
-
155
-
156
-
157
-
158
-
159
-
160
-
161
-
162
-
163
-
164
-
165
-
166
-
167
-
168
-
169
-
170
-
171
-
172
-
173
-
174
-
175
-
176
-
177
-
178
-
179
-
180
 |
 |