Casio FX9750GII User Guide - Page 10
Mode Name, Description, The following explains the meaning of each icon. - programs
 |
UPC - 079767186050
View all Casio FX9750GII manuals
Add to My Manuals
Save this manual to your list of manuals |
Page 10 highlights
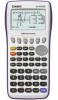
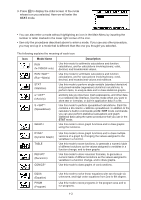
3. Press U to display the initial screen of the mode whose icon you selected. Here we will enter the STAT mode. • You can also enter a mode without highlighting an icon in the Main Menu by inputting the number or letter marked in the lower right corner of the icon. • Use only the procedures described above to enter a mode. If you use any other procedure, you may end up in a mode that is different than the one you thought you selected. The following explains the meaning of each icon. Icon Mode Name RUN (fx-7400Gɉ only) RUN • MAT*1 (Run • Matrix) Description Use this mode for arithmetic calculations and function calculations, and for calculations involving binary, octal, decimal, and hexadecimal values. Use this mode for arithmetic calculations and function calculations, and for calculations involving binary, octal, decimal, and hexadecimal values and matrices. STAT (Statistics) e • ACT*2 (eActivity) S • SHT*2 (Spreadsheet) GRAPH Use this mode to perform single-variable (standard deviation) and paired-variable (regression) statistical calculations, to perform tests, to analyze data and to draw statistical graphs. eActivity lets you input text, math expressions, and other data in a notebook-like interface. Use this mode when you want to store text or formulas, or built-in application data in a file. Use this mode to perform spreadsheet calculations. Each file contains a 26-column × 999-line spreadsheet. In addition to the calculator's built-in commands and S • SHT mode commands, you can also perform statistical calculations and graph statistical data using the same procedures that you use in the STAT mode. Use this mode to store graph functions and to draw graphs using the functions. DYNA*1 (Dynamic Graph) TABLE RECUR*1 (Recursion) CONICS*1 Use this mode to store graph functions and to draw multiple versions of a graph by changing the values assigned to the variables in a function. Use this mode to store functions, to generate a numeric table of different solutions as the values assigned to variables in a function change, and to draw graphs. Use this mode to store recursion formulas, to generate a numeric table of different solutions as the values assigned to variables in a function change, and to draw graphs. Use this mode to draw graphs of conic sections. EQUA (Equation) PRGM (Program) Use this mode to solve linear equations with two through six unknowns, and high-order equations from 2nd to 6th degree. Use this mode to store programs in the program area and to run programs. 1-3
-
 1
1 -
2
-
3
-
4
-
 5
5 -
 6
6 -
 7
7 -
 8
8 -
 9
9 -
 10
10 -
 11
11 -
 12
12 -
 13
13 -
 14
14 -
 15
15 -
16
-
17
-
18
-
19
-
20
-
21
-
22
-
23
-
24
-
25
-
26
-
27
-
28
-
29
-
30
-
31
-
32
-
33
-
34
-
35
-
36
-
37
-
38
-
39
-
40
-
41
-
42
-
43
-
44
-
45
-
46
-
47
-
48
-
49
-
50
-
51
-
52
-
53
-
54
-
55
-
56
-
57
-
58
-
59
-
60
-
61
-
62
-
63
-
64
-
65
-
66
-
67
-
68
-
69
-
70
-
71
-
72
-
73
-
74
-
75
-
76
-
77
-
78
-
79
-
80
-
81
-
82
-
83
-
84
-
85
-
86
-
87
-
88
-
89
-
90
-
91
-
92
-
93
-
94
-
95
-
96
-
97
-
98
-
99
-
100
-
101
-
102
-
103
-
104
-
105
-
106
-
107
-
108
-
109
-
110
-
111
-
112
-
113
-
114
-
115
-
116
-
117
-
118
-
119
-
120
-
121
-
122
-
123
-
124
-
125
-
126
-
127
-
128
-
129
-
130
-
131
-
132
-
133
-
134
-
135
-
136
-
137
-
138
-
139
-
140
-
141
-
142
-
143
-
144
-
145
-
146
-
147
-
148
-
149
-
150
-
151
-
152
-
153
-
154
-
155
-
156
-
157
-
158
-
159
-
160
-
161
-
162
-
163
-
164
-
165
-
166
-
167
-
168
-
169
-
170
-
171
-
172
-
173
-
174
-
175
-
176
-
177
-
178
-
179
-
180
-
181
-
182
-
183
-
184
-
185
-
186
-
187
-
188
-
189
-
190
-
191
-
192
-
193
-
194
-
195
-
196
-
197
-
198
-
199
-
200
-
201
-
202
-
203
-
204
-
205
-
206
-
207
-
208
-
209
-
210
-
211
-
212
-
213
-
214
-
215
-
216
-
217
-
218
-
219
-
220
-
221
-
222
-
223
-
224
-
225
-
226
-
227
-
228
-
229
-
230
-
231
-
232
-
233
-
234
-
235
-
236
-
237
-
238
-
239
-
240
-
241
-
242
-
243
-
244
-
245
-
246
-
247
-
248
-
249
-
250
-
251
-
252
-
253
-
254
-
255
-
256
-
257
-
258
-
259
-
260
-
261
-
262
-
263
-
264
-
265
-
266
-
267
-
268
-
269
-
270
-
271
-
272
-
273
-
274
-
275
-
276
-
277
-
278
-
279
-
280
-
281
-
282
-
283
-
284
-
285
-
286
-
287
-
288
-
289
-
290
-
291
-
292
-
293
-
294
-
295
-
296
-
297
-
298
-
299
-
300
-
301
-
302
-
303
-
304
-
305
-
306
-
307
-
308
-
309
-
310
-
311
-
312
-
313
-
314
-
315
-
316
-
317
-
318
-
319
-
320
-
321
-
322
-
323
-
324
-
325
-
326
-
327
-
328
-
329
-
330
-
331
-
332
-
333
-
334
-
335
-
336
-
337
-
338
-
339
-
340
-
341
-
342
-
343
-
344
-
345
-
346
-
347
-
348
-
349
-
350
-
351
-
352
-
353
-
354
-
355
-
356
-
357
-
358
-
359
-
360
-
361
-
362
-
363
-
364
-
365
-
366
-
367
-
368
-
369
-
370
-
371
-
372
-
373
-
374
-
375
-
376
-
377
-
378
-
379
-
380
-
381
-
382
-
383
-
384
-
385
-
386
-
387
-
388
-
389
-
390
-
391
-
392
-
393
-
394
-
395
-
396
-
397
-
398
-
399
-
400
-
401
-
402
-
403
-
404
-
405
-
406
-
407
-
408
-
409
-
410
-
411
-
412
 |
 |
