Cisco SD208T-EU User Guide - Page 34
RMON History, Statistics > RMON Alarms
 |
View all Cisco SD208T-EU manuals
Add to My Manuals
Save this manual to your list of manuals |
Page 34 highlights
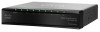
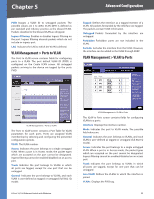
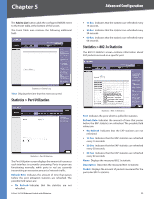
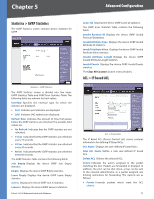
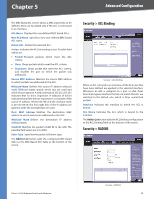
Chapter 5 Advanced Configuration Current Number of Samples Displays the current number of samples taken. RMON History Statistics > History Table The RMON History screen contains interface specific statistical network samplings. Each table entry represents all counter values compiled during a single sample. History Entry No Displays the history table entry number. Owner Displays the RMON station or user that requested the RMON information. The field range is 0-20 characters. Sample No Indicates the sample number from which the statistics were taken. Drop Events Displays the number of dropped events that have occurred on the interface since the device was last refreshed. Received Bytes (Octets) Displays the number of octets received on the interface since the device was last refreshed. This number includes bad packets and FCS octets, but excludes framing bits. Received Packets Displays the number of packets received on the interface since the device was last refreshed, including bad packets, Multicast and Broadcast packets. Broadcast Packets Displays the number of good Broadcast packets received on the interface since the device was last refreshed. This number does not include Multicast packets. Multicast Packets Displays the number of good Multicast packets received on the interface since the device was last refreshed. 8-Port 10/100 Ethernet Switch with Webview CRC Align Errors Displays the number of CRC and Align errors that have occurred on the interface since the device was last refreshed. Undersize Packets Displays the number of undersized packets (less than 64 octets) received on the interface since the device was last refreshed. Oversize Packets Displays the number of oversized packets (over 1518 octets) received on the interface since the device was last refreshed. Fragments Displays the number of fragments (packets with less than 64 octets, excluding framing bits, but including FCS octets) received on the interface since the device was last refreshed. Jabbers Displays the total number of received packets that were longer than 1518 octets. This number excludes frame bits, but includes FCS octets that had either a bad Frame Check Sequence (FCS) with an integral number of octets (FCS Error) or a bad FCS with a non-integral octet (Alignment Error) number. The field range to detect jabbers is between 20 ms and 150 ms. Collisions Displays the number of collisions received on the interface since the device was last refreshed. Utilization Displays the percentage of the interface utilized. Statistics > RMON Alarms The RMON Alarm screen contains fields for setting network alarms. Network alarms occur when a network problem, or event, is detected. Rising and falling thresholds generate events. Statistics > RMON Alarms Alarm Entry Indicates a specific alarm. Source Interface Displays the interface for which RMON statistics are displayed. The possible field values are: 28
-
 1
1 -
2
-
3
-
4
-
5
-
6
-
7
-
8
-
9
-
10
-
11
-
12
-
13
-
14
-
15
-
16
-
17
-
18
-
19
-
20
-
21
-
22
-
23
-
24
-
25
-
26
-
27
-
28
-
 29
29 -
 30
30 -
 31
31 -
 32
32 -
 33
33 -
 34
34 -
 35
35 -
 36
36 -
 37
37 -
 38
38 -
 39
39 -
40
-
41
-
42
-
43
-
44
-
45
-
46
-
47
-
48
-
49
-
50
-
51
-
52
-
53
-
54
-
55
-
56
-
57
-
58
-
59
-
60
-
61
-
62
-
63
-
64
-
65
-
66
-
67
-
68
-
69
-
70
-
71
-
72
-
73
-
74
-
75
-
76
-
77
-
78
-
79
-
80
-
81
-
82
-
83
-
84
-
85
-
86
 |
 |