Compaq ProLiant 6000 Performance of Microsoft Exchange Server 5.0 on Compaq Pr - Page 7
LoadSim Score
 |
View all Compaq ProLiant 6000 manuals
Add to My Manuals
Save this manual to your list of manuals |
Page 7 highlights
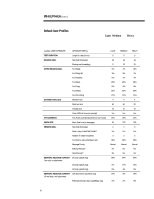
ECG052.0897 WHITE PAPER (cont.) 7... LoadSim USER ATTRIBUTE ATTRIBUTE DETAIL Word attachment (upsWDatt.msg) Excel attachment (upsXLatt.msg) Embedded Excel object (upsXLobj.msg) SCHEDULE+ CHANGES Changes per day Update Free/Busy information? Average Schedule File Size PUBLIC FOLDERS Folder activity CALCULATED DAILY LOAD (based on these defaults) TOTAL MAIL RECEIVED PER DAY CALCULATED DAILY LOAD (based on these defaults) TOTAL MAIL SENT PER DAY Mail sent as New mail Mail sent as a Reply Mail sent as a Reply to All Mail sent as a Forward CALCULATED DAILY LOAD (based on these defaults) AVERAGE # RECIPIENTS FOR EACH MESSAGE Table 1. Default LoadSim user profile definitions LIGHT 0% 0% 0% 1 No 22K None 22.94 MEDIUM 2% 4% 2% 5 No 22K None 66.30 HEAVY 5% 5% 10% 10 No 22K None 118.89 4.70 14.18 30.67 2.00 4.00 6.00 1.05 3.76 13.03 0.60 2.67 5.82 1.05 3.76 5.82 4.88 4.68 3.88 LoadSim Score If we have several recorded response times for some action, why not just use the average response time, or the maximum, to determine acceptability? This approach does not work for several reasons. The average response time does not tell you anything about the distribution of response times. For example, you will get the same average if all your actions took two seconds, or if half took one second and the other half took three seconds. However, there is a big difference in user perception between these two distributions. We do not use the maximum response time here because of the quantum effect, explained in a previous section. In a user-driven client/server system like Microsoft Exchange Server, there is always a statistical chance that several clients will require the same resource at the same time, and some will have to wait longer than usual. As a result, the maximum response time is not really a fair measure of acceptability. Instead, we use the 95th percentile (as recommended by Microsoft). If the 95th percentile response time for a set of actions is one second, that means 95 percent of the response times are at or below one second. Only five percent (one in twenty) of the response times exceeded one second. For comparison, the maximum response time is just the 100th percentile (100 percent of the response times are at or below the maximum). The median of a set of response times is defined as the 50th percentile (not to be confused with the mean, which is the average). The 95th percentile is statistically accurate and based on the entire set of response times, but is also fair to the quantum effect and real-world user perception.
-
 1
1 -
 2
2 -
 3
3 -
 4
4 -
 5
5 -
 6
6 -
 7
7 -
 8
8 -
 9
9 -
 10
10 -
 11
11 -
 12
12 -
13
-
14
-
15
-
16
-
17
-
18
-
19
-
20
-
21
-
22
-
23
 |
 |
