Dell 8 Fabric OS Administrator’s Guide - Page 433
ISL performance monitoring, Top Talker monitors
 |
View all Dell 8 manuals
Add to My Manuals
Save this manual to your list of manuals |
Page 433 highlights
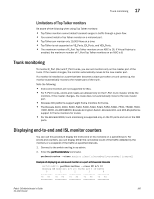
ISL performance monitoring 17 Example This example clears the counters for the ABTS monitor from ports 7 through 10. switch:admin> fmconfig --clear ABTS -port 7-10 ISL performance monitoring ISL monitoring is set up on E_Ports automatically. An ISL monitor measures traffic to all reachable destination domains for an ISL, showing which destination domain is consuming the most traffic. If there are more than 16 domains, the monitor samples traffic and extrapolates the measurement. EE monitors on E_Ports are deleted when they become part of an ISL. ISL monitors are deleted when Top Talker is installed and are restored when Top Talker is deleted. (See "Top Talker monitors" for information about monitor features and implementation.) You can monitor ISL performance using the perfMonitorShow command, as described in "Displaying end-to-end and ISL monitor counters." You can clear ISL counters using the perfMonitorClear command, as described in "Clearing end-to-end and ISL monitor counters" on page 398. ISL monitoring is supported on a limited number of platforms. See Table 81 on page 384 for the list of platforms on which ISL monitoring is supported. Virtual Fabrics considerations: ISL monitors are supported only on the default logical switch and not on the base switch or other logical switches. Top Talker monitors Top Talker monitors determine the flows (SID/DID pairs) that are the major users of bandwidth (after initial stabilization). Top Talker monitors measure bandwidth usage data in real-time and relative to the port on which the monitor is installed. NOTE Initial stabilization is the time taken by a flow to reach the maximum bandwidth. This time varies depending on the number of flows in the fabric and other factors. The incubation period can be up to 14 seconds in the Brocade DCX and DCX-4S, and up to 82 seconds in the Brocade 4100, 4900, 5000, 5100, 5300, 7500, 7500E, 7600, 7800, 8000, VA-40FC, 48000, and Brocade Encryption Switch. Top Talker monitors are not supported on the CEE ports of the Brocade 8000 switch. Applications can use the Top Talker data to do the following: • Re-route the traffic through different ports that are less busy, so as not to overload a given port. • Alert you to the top-talking flows on a port if the total traffic on the port exceeds the acceptable bandwidth consumption. You can use Top Talkers to identify the SID/DID pairs that consume the most bandwidth and can then configure them with certain Quality of Service (QoS) attributes so they get proper priority. See Chapter 18, "Optimizing Fabric Behavior," for information on QoS. Fabric OS Administrator's Guide 393 53-1001763-02
-
 1
1 -
2
-
3
-
4
-
5
-
6
-
7
-
8
-
9
-
10
-
11
-
12
-
13
-
14
-
15
-
16
-
17
-
18
-
19
-
20
-
21
-
22
-
23
-
24
-
25
-
26
-
27
-
28
-
29
-
30
-
31
-
32
-
33
-
34
-
35
-
36
-
37
-
38
-
39
-
40
-
41
-
42
-
43
-
44
-
45
-
46
-
47
-
48
-
49
-
50
-
51
-
52
-
53
-
54
-
55
-
56
-
57
-
58
-
59
-
60
-
61
-
62
-
63
-
64
-
65
-
66
-
67
-
68
-
69
-
70
-
71
-
72
-
73
-
74
-
75
-
76
-
77
-
78
-
79
-
80
-
81
-
82
-
83
-
84
-
85
-
86
-
87
-
88
-
89
-
90
-
91
-
92
-
93
-
94
-
95
-
96
-
97
-
98
-
99
-
100
-
101
-
102
-
103
-
104
-
105
-
106
-
107
-
108
-
109
-
110
-
111
-
112
-
113
-
114
-
115
-
116
-
117
-
118
-
119
-
120
-
121
-
122
-
123
-
124
-
125
-
126
-
127
-
128
-
129
-
130
-
131
-
132
-
133
-
134
-
135
-
136
-
137
-
138
-
139
-
140
-
141
-
142
-
143
-
144
-
145
-
146
-
147
-
148
-
149
-
150
-
151
-
152
-
153
-
154
-
155
-
156
-
157
-
158
-
159
-
160
-
161
-
162
-
163
-
164
-
165
-
166
-
167
-
168
-
169
-
170
-
171
-
172
-
173
-
174
-
175
-
176
-
177
-
178
-
179
-
180
-
181
-
182
-
183
-
184
-
185
-
186
-
187
-
188
-
189
-
190
-
191
-
192
-
193
-
194
-
195
-
196
-
197
-
198
-
199
-
200
-
201
-
202
-
203
-
204
-
205
-
206
-
207
-
208
-
209
-
210
-
211
-
212
-
213
-
214
-
215
-
216
-
217
-
218
-
219
-
220
-
221
-
222
-
223
-
224
-
225
-
226
-
227
-
228
-
229
-
230
-
231
-
232
-
233
-
234
-
235
-
236
-
237
-
238
-
239
-
240
-
241
-
242
-
243
-
244
-
245
-
246
-
247
-
248
-
249
-
250
-
251
-
252
-
253
-
254
-
255
-
256
-
257
-
258
-
259
-
260
-
261
-
262
-
263
-
264
-
265
-
266
-
267
-
268
-
269
-
270
-
271
-
272
-
273
-
274
-
275
-
276
-
277
-
278
-
279
-
280
-
281
-
282
-
283
-
284
-
285
-
286
-
287
-
288
-
289
-
290
-
291
-
292
-
293
-
294
-
295
-
296
-
297
-
298
-
299
-
300
-
301
-
302
-
303
-
304
-
305
-
306
-
307
-
308
-
309
-
310
-
311
-
312
-
313
-
314
-
315
-
316
-
317
-
318
-
319
-
320
-
321
-
322
-
323
-
324
-
325
-
326
-
327
-
328
-
329
-
330
-
331
-
332
-
333
-
334
-
335
-
336
-
337
-
338
-
339
-
340
-
341
-
342
-
343
-
344
-
345
-
346
-
347
-
348
-
349
-
350
-
351
-
352
-
353
-
354
-
355
-
356
-
357
-
358
-
359
-
360
-
361
-
362
-
363
-
364
-
365
-
366
-
367
-
368
-
369
-
370
-
371
-
372
-
373
-
374
-
375
-
376
-
377
-
378
-
379
-
380
-
381
-
382
-
383
-
384
-
385
-
386
-
387
-
388
-
389
-
390
-
391
-
392
-
393
-
394
-
395
-
396
-
397
-
398
-
399
-
400
-
401
-
402
-
403
-
404
-
405
-
406
-
407
-
408
-
409
-
410
-
411
-
412
-
413
-
414
-
415
-
416
-
417
-
418
-
419
-
420
-
421
-
422
-
423
-
424
-
425
-
426
-
427
-
 428
428 -
 429
429 -
 430
430 -
 431
431 -
 432
432 -
 433
433 -
 434
434 -
 435
435 -
 436
436 -
 437
437 -
 438
438 -
439
-
440
-
441
-
442
-
443
-
444
-
445
-
446
-
447
-
448
-
449
-
450
-
451
-
452
-
453
-
454
-
455
-
456
-
457
-
458
-
459
-
460
-
461
-
462
-
463
-
464
-
465
-
466
-
467
-
468
-
469
-
470
-
471
-
472
-
473
-
474
-
475
-
476
-
477
-
478
-
479
-
480
-
481
-
482
-
483
-
484
-
485
-
486
-
487
-
488
-
489
-
490
-
491
-
492
-
493
-
494
-
495
-
496
-
497
-
498
-
499
-
500
-
501
-
502
-
503
-
504
-
505
-
506
-
507
-
508
-
509
-
510
-
511
-
512
-
513
-
514
-
515
-
516
-
517
-
518
-
519
-
520
-
521
-
522
-
523
-
524
-
525
-
526
-
527
-
528
-
529
-
530
-
531
-
532
-
533
-
534
-
535
-
536
-
537
-
538
-
539
-
540
-
541
-
542
-
543
-
544
-
545
-
546
-
547
-
548
-
549
-
550
-
551
-
552
-
553
-
554
-
555
-
556
-
557
-
558
-
559
-
560
-
561
-
562
-
563
-
564
-
565
-
566
-
567
-
568
-
569
-
570
-
571
-
572
-
573
-
574
-
575
-
576
-
577
-
578
-
579
-
580
-
581
-
582
-
583
-
584
-
585
-
586
 |
 |