Dell PowerEdge M1000e Fabric Watch Administrator’s Guide - Page 117
Switch Health report, Generating a Switch Health report
 |
View all Dell PowerEdge M1000e manuals
Add to My Manuals
Save this manual to your list of manuals |
Page 117 highlights
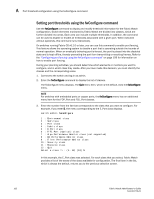
Switch Health report 9 2/12 2/13 2/14 2/15 3/0 3/1 3/2 3/3 3/4 3/5 3/6 3/7 3/8 3/9 3/10 . . . LB 100 0 0 0 LB 100 0 0 0 U 0 0 0 100 LB 100 0 0 0 T 100 0 0 0 U 0 0 0 100 U 0 0 0 100 U 0 0 0 100 U 0 0 0 100 U 0 0 0 100 U 0 0 0 100 U 0 0 0 100 U 0 0 0 100 U 0 0 0 100 VE 100 0 0 0 Switch Health report The Switch Health report lists the following information: • Current health of each port, based on the currently-configured policy settings. • High-level state of the switch, the power supplies and temperature monitor. • All ports that are in an abnormal state and the current health state of each port. The switch health report is available even without Fabric Watch, but for licensed Fabric Watch users, the marginal and faulty ports are included in the report. The following is an example of a switch health report. NOTE Switch health report details do not display the health status of GbE ports. Fabric Watch only monitors and reports the status for physical and virtual FC ports. Generating a Switch Health report 1. Connect to the switch and log in as admin. 2. Enter the switchStatusShow command to generate a Switch Health report. cp0 login: admin Password: Sat 240 :admin> switchstatusshow Switch Health Report Switch Name: Sat 240 IP address: 1080::8:800:200C:417A SwitchState: HEALTHY Duration: 01:10 Report time: 08/21/2006 05:23:22 PM Power supplies monitor Temperatures monitor Fans monitor WWN servers monitor Standby CP monitor HEALTHY HEALTHY HEALTHY HEALTHY HEALTHY Fabric Watch Administrator's Guide 97 53-1001770-01
-
 1
1 -
2
-
3
-
4
-
5
-
6
-
7
-
8
-
9
-
10
-
11
-
12
-
13
-
14
-
15
-
16
-
17
-
18
-
19
-
20
-
21
-
22
-
23
-
24
-
25
-
26
-
27
-
28
-
29
-
30
-
31
-
32
-
33
-
34
-
35
-
36
-
37
-
38
-
39
-
40
-
41
-
42
-
43
-
44
-
45
-
46
-
47
-
48
-
49
-
50
-
51
-
52
-
53
-
54
-
55
-
56
-
57
-
58
-
59
-
60
-
61
-
62
-
63
-
64
-
65
-
66
-
67
-
68
-
69
-
70
-
71
-
72
-
73
-
74
-
75
-
76
-
77
-
78
-
79
-
80
-
81
-
82
-
83
-
84
-
85
-
86
-
87
-
88
-
89
-
90
-
91
-
92
-
93
-
94
-
95
-
96
-
97
-
98
-
99
-
100
-
101
-
102
-
103
-
104
-
105
-
106
-
107
-
108
-
109
-
110
-
111
-
 112
112 -
 113
113 -
 114
114 -
 115
115 -
 116
116 -
 117
117 -
 118
118 -
 119
119 -
 120
120 -
 121
121 -
 122
122 -
123
-
124
-
125
-
126
-
127
-
128
-
129
-
130
-
131
-
132
-
133
-
134
-
135
-
136
-
137
-
138
-
139
-
140
-
141
-
142
-
143
-
144
 |
 |