Dell PowerEdge R720xd Dell SMB Reference Configuration for Microsoft SQL Serve - Page 12
Power Edge R720-xd - poweredge r720 xd server
 |
View all Dell PowerEdge R720xd manuals
Add to My Manuals
Save this manual to your list of manuals |
Page 12 highlights
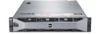
Dell SMB Reference Configuration for Microsoft SQL Server 2012 Fast Track Data Warehouse on PowerEdge R720xd SQLIO. This test verifies the maximum bandwidth available in the system to ensure no bottlenecks are within the data path. Figure 7. SQLIO Line Rate Test from Cache (Small File) POWER EDGE R720-XD SQL Server 2012 Enterprise Single Socket Intel four core Aggregate Synthetic I/O rate: 2700 MB/s H710P PERC Controller Synthetic I/O rate: 2700 MB/s SQL Server 2012 Windows Server 2008 R2 SP1 Intel E5-2643 4 core CPU INTERNAL STORAGE PERC H700 Controller RAID 1 RAID 1 RAID 1 RAID 1 RAID 1 RAID 1 RAID 1 RAID 1 RAID 1 RAID 10 Single RAID 1 Disk Group Synthetic I/O rate: 2669 MB/s The second synthetic I/O test with SQLIO was performed with a large file to ensure reads are serviced from the storage system hard drives instead of from cache. Figure 8 shows the maximum real rate that the system is able to provide with sequential reads. 12
-
 1
1 -
2
-
3
-
4
-
5
-
6
-
 7
7 -
 8
8 -
 9
9 -
 10
10 -
 11
11 -
 12
12 -
 13
13 -
 14
14 -
 15
15 -
 16
16
 |
 |
