Fluke 179 Fluke Precision Multimeters - Understanding Specifications for Preci - Page 2
Where do uncertainty, specifications come from?, Traceability and, specifications - meter
 |
View all Fluke 179 manuals
Add to My Manuals
Save this manual to your list of manuals |
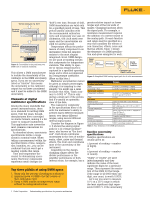
Page 2 highlights
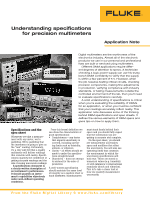
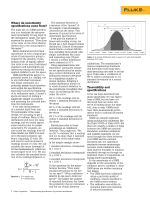
Where do uncertainty specifications come from? The main job of a DMM specification is to establish the measurement uncertainty for any input in the instrument's range. The spec answers the question, "How close is the value on the meter display likely to be to the actual input to the meter?" Meter manufacturers bet their reputations on how a large population of instruments is going to behave for the duration of calibration cycle. (A typical calibration cycle is one year.) Instrument engineers and metrologists use laboratory testing and carefully applied statistics to set the specs. DMM specifications apply to a particular model (i.e. design), not to any individual instrument. Any single instrument of a particular design should perform well within the specification, especially toward the beginning of its calibration cycle. A model's specs are based on testing a significant sample of products and analyzing the collected data from the instruments. If we take measurements of a nominal input from, say, 50 instruments of the same design, we are going to get a range of readings. Many of the instruments will have the same readings, but we would expect some variation due to normal uncertainty. For example, we can record the readings from 50 Fluke Model xyz DMM's hooked up to the same precision calibrator outputting 10 volts. We will record a narrow spread of readings around 10 volts. We can calculate the mean (average) of all the measurements, which we would expect to be 10 V. We can also calculate the standard deviation of the readings (Equation 1). The standard deviation is a measure of the "spread" of the sample of measurements, outward from the mean. This measure of spread is the basis of uncertainty specifications. If we plot the number of times each reading occurs, we should see a bell-shaped normal distribution. (Almost all measurements follow a normal distribution, including those made with simple instruments like rulers and measuring cups.) Figure 1 shows a normal distribution curve centered at 10 V. Using experimentation and experience, instrument designers set specifications by assuming a normal distribution and finding the standard deviation for a significant number of design samples. Adopting a normal distribution allows us to relate standard deviation to the percentage of readings that occur, by measuring the area under the curve. 68 % of the readings will be within 1 standard deviation of the mean 95 % of the readings will fall within 2 standard deviations of the mean 99.7 % of the readings will fall within 3 standard deviations of the mean Statisticians refer to these percentages as confidence intervals. They might say, "We are 95 % confident that a reading will not be more than 2 standard deviations of the actual value." In the simple example above 1 standard deviation corresponds to ± 0.02 V 2 standard deviations corresponds to ± 0.04 V 3 standard deviations corresponds to ± 0.06 V Equation 1. N = sample size X = measurement So the questions for the manufacturer become, "How many standard deviations do we use for our spec?" "What confidence interval do we use to build our specs?" The higher the number of standard deviations, the lower the probability that an instrument will fall out of spec between 2 Fluke Corporation Understanding specifications for precision multimeters 9.9200 9.9400 9.9600 9.9800 10.0000 10.0200 10.0400 10.0600 10.0800 Figure 1: A normal distribution with a mean of 10 volts and standard deviation 0.02 volts. calibrations. The manufacturer's internal engineering standards will determine how many standard deviations are used to set the spec. Fluke uses a confidence of 99 %, which corresponds to 2.6 standard deviations on a normal distribution. Traceability and specifications So far we have described how much uncertainty we can expect from a DMM, but we have not discussed how we make sure we're all talking about the same volt, ohm or amp. DMMs must trace their measurement performance back to national laboratory standards. DMMs are usually calibrated using multifunction calibrators like the Fluke 5700A or Fluke 9100. But there are usually a number of links between the DMM and national standards, including calibrators and transfer standards. As you move through the chain between your DMM and the national standards lab, the calibration standards become increasingly accurate. Each calibration standard must be traceable to national standards through an through an unbroken chain of comparisons, all having stated uncertainties. So the uncertainty of a DMM depends on the uncertainty of the calibrator used to calibrate it. Most DMM specs are written assuming two things: • The DMM has been calibrated using a particular model of calibrator, usually specified in the DMM service manual. • The calibrator was within its operating limits and traceable to national standards.
-
 1
1 -
 2
2 -
 3
3 -
 4
4
 |
 |