Fluke 190-204/S Fluke 190-Series II 4-Channel ScopeMeters Product Datasheet - Page 3
C Series, Series II - software
 |
View all Fluke 190-204/S manuals
Add to My Manuals
Save this manual to your list of manuals |
Page 3 highlights
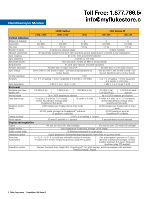
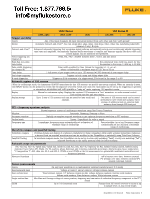
190C Series 190 Series II 199C, 225C 196C, 215C 192C 190-204 190-104 Trigger and delay Source Any of the input channels. All input references isolated from each other and from 'earth ground'. Modes Automatic Connect-and-View™, free run, single shot, edge, delay, dual slope, video, video line, selectable pulsewidth (channel A only), N-cycle Connect-and-View™ Advanced automatic triggering that recognizes signal patterns, automatically sets up and continuously adjusts triggering, time base and amplitude. Automatically displays stable waveforms of complex and dynamic signals like motor drive and control signals. Can be switched off if preferred. Video triggering (on channel A) NTSC, PAL, PAL+, SECAM. Includes field 1, field 2 and line select. High-Res, non-interlaced video - Non-interlaced video with line-select, for line frequencies in the range 14 kHz up to 65 kHz Pulse width triggering (on channel A) Pulse width qualified by time. Allows for triggering t, =t, ≠ t, where t is selectable in minimum steps of 0.01 div or 50 ns. Time delay 1 full screen of pre-trigger view or up to 100 screens (=1200 divisions) of post-trigger delay Dual slope triggering Triggers on both rising and falling edges alike N-cycle triggering Triggers on N-th occurrence of a trigger event; N to be set in the range 2 to 99 Automatic capture of 100 screens When in oscilloscope mode, the instrument ALWAYS memorizes the last 100 screens-no specific user setup required. When an anomaly is seen, the REPLAY button can be pressed to review the full sequence of screen events over and over. Instrument can be set up for triggering on glitches or intermittent anomalies and will operate in "baby-sit" mode capturing 100 specified events. Replay Manual or continuous replay. Displays the captured 100 screens as a "live" animation, or under manual control. Each screen has date and time-stamp. Replay storage Up to 2 sets of 100 screens each can be saved for later recall and analysis. Two sets of 100 screens each can be saved internally for later recall and analysis. Direct storage of additional sets on external flash memory drive through USB host port. FFT - frequency spectrum analysis Shows frequency content of oscilloscope waveform using Fast Fourier Transform Window Automatic, Hamming, Henning or None Automatic window Digitally re-samples acquired waveform to get optimum frequency resolution in FFT resultant Vertical scale Linear / Logarithmic (in volts or amps) Frequency axis Logarithmic; frequency range automatically set as function of timebase range of oscilloscope User selectable: lin or log. Frequency range automatically set as a function of timebase range of oscilloscope. Waveform compare and pass/fail testing Waveform compare Provides storage and display of a reference waveform for visual comparison with newly acquired waveforms. Reference is derived from an acquired waveform and can be modified in the ScopeMeter or externally using FlukeView Software. Pass/Fail Testing In waveform compare mode, the ScopeMeter can be set up to store only matching ("Pass") or only non-matching ("Fail") acquired waveforms in the replay memory bank for further analysis Automatic scope measurements Vdc, Vac rms, Vac+dc, Vpeak max, Vpeak min, Vpeak to peak, Aac, Adc, Aac+dc, frequency (in Hz), risetime (using cursors), falltime (using cursors), Power Factor (PF), Watts, VA, VA reactive, phase (between any 2 inputs), pulsewidth (pos./neg.), dutycycle (pos./neg.), temperature °C, temperature °F, dBV, dBm into 50 Ω and 600 Ω, VPWM ac and VPWM ac+dc for measurement on pulsewidth modulated motordrives and frequency inverters Advanced functions - mA*s (current-over-time, between cursors) V*s (voltage over time, between cursors) W*s (energy, between cursors) Cursor measurements Source On any input waveform or on mathematical resultant waveform (excl. X-Y-mode) Dual horizontal lines Voltage at cursor 1 and at cursor 2, voltage between cursors Dual vertical lines Time between cursors, 1/T between cursors (in Hz), voltage between markers, risetime with markers, falltime with markers; Vrms between cursors, Watts between cursors Single vertical line Min-Max and Average voltage at cursor position; frequency and rms-value of individual frequency component in the FFT Result ZOOM Up to 16x horizontal zoom Ranges from full record overview to zoom in up to sample level, at any record length ScopeMeter 190 Series II Fluke Corporation 3
-
 1
1 -
 2
2 -
 3
3 -
 4
4 -
 5
5 -
 6
6 -
 7
7 -
 8
8
 |
 |