Fluke 190-204/S Fluke ScopeMeter Family Datasheet - 120, 190, 190 Series II - Page 7
Persistence, FFT - software
 |
View all Fluke 190-204/S manuals
Add to My Manuals
Save this manual to your list of manuals |
Page 7 highlights
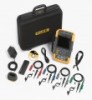
Persistence, FFT, mathematics and pass fail waveform envelope testing FlukeView® ScopeMeter software for documenting, archiving and analysis Get more out of your ScopeMeter with FlukeView® ScopeMeter® SW90W Software for Windows. • Documentation-transfer waveforms, screens and data to your PC for printing or importing data into a report • Add text to ScopeMeter settings-give operators guidance when recalling settings • Archives-create a library of waveforms for easy reference, waveform comparison, or pass/fail testing • Analysis-use cursors, perform spectrum analysis or export data to another analysis program • Connect to your PC with optically isolated USB port Look back in time with automatic capture and display of last 100 screens It's frustrating to see a one-time anomaly flash and miss it. Fluke ScopeMeter will solve the problem by letting you look back in time with a touch of the replay button. • In normal use, the instrument continuously memorizes the last 100 screens. As each new screen is acquired, the oldest is discarded. • At any moment you can "freeze" the last 100 screens and scroll through picture-bypicture or replay as a "live" animation • Use cursors for further analysis • With advanced triggering you can capture up to 100 specific events (Two sets of 100 captured screens with individual time stamps can be stored for later recall or downloaded to a PC.) Pass/Fail testing of actual signal against a reference template. Digital Persistence mode gives analog scope-like display of complex and modulated signals. Cursors and automatic waveform measurements With 30 automatic measurements, cursors, zoom and a real-time clock, the ScopeMeter will perform automatic power and Vrms measurements on the specific portion of the waveform you select within a specified time span. Dual-slope triggering used to capture the eye-pattern on a digital datastream. Frequency Spectrum shows an overview of frequencies contained in a signal. 7
-
 1
1 -
 2
2 -
 3
3 -
 4
4 -
 5
5 -
 6
6 -
 7
7 -
 8
8 -
 9
9 -
 10
10
 |
 |
