Garmin GPSMAP 721xs Owner's Manual - Page 64
Understanding the Split Frequency Screen, Sonar, Split Frequency, Split Zoom
 |
View all Garmin GPSMAP 721xs manuals
Add to My Manuals
Save this manual to your list of manuals |
Page 64 highlights
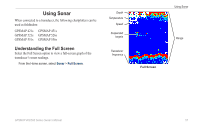
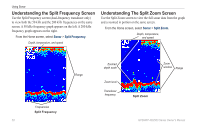
Using Sonar Understanding the Split Frequency Screen Use the Split Frequency screen (dual-frequency transducer only) to view both the 50 kHz and the 200 kHz frequencies on the same screen. A 50 kHz frequency graph appears on the left. A 200 kHz frequency graph appears on the right. From the Home screen, select Sonar > Split Frequency. Depth, temperature, and speed Understanding The Split Zoom Screen Use the Split Zoom screen to view the full sonar data from the graph and a zoomed in portion on the same screen. From the Home screen, select Sonar > Split Zoom. Depth, temperature, and speed Range Frequencies Split Frequency 58 Zoomed depth scale Zoom level Transducer frequency Zoom window Range Split Zoom GPSMAP 400/500 Series Owner's Manual
-
 1
1 -
2
-
3
-
4
-
5
-
6
-
7
-
8
-
9
-
10
-
11
-
12
-
13
-
14
-
15
-
16
-
17
-
18
-
19
-
20
-
21
-
22
-
23
-
24
-
25
-
26
-
27
-
28
-
29
-
30
-
31
-
32
-
33
-
34
-
35
-
36
-
37
-
38
-
39
-
40
-
41
-
42
-
43
-
44
-
45
-
46
-
47
-
48
-
49
-
50
-
51
-
52
-
53
-
54
-
55
-
56
-
57
-
58
-
 59
59 -
 60
60 -
 61
61 -
 62
62 -
 63
63 -
 64
64 -
 65
65 -
 66
66 -
 67
67 -
 68
68 -
 69
69 -
70
-
71
-
72
-
73
-
74
-
75
-
76
-
77
-
78
-
79
-
80
-
81
-
82
-
83
-
84
 |
 |

58
GPSMAP 400/500 Series Owner’s Manual
Using Sonar
Understanding the Split Frequency Screen
Use the Split Frequency screen (dual-frequency transducer only)
to view both the 50 kHz and the 200 kHz frequencies on the same
screen. A 50 kHz frequency graph appears on the left. A 200 kHz
frequency graph appears on the right.
From the Home screen, select
Sonar
>
Split Frequency
�
Depth, temperature, and speed
Range
Frequencies
Split Frequency
Understanding The Split Zoom Screen
Use the Split Zoom screen to view the full sonar data from the graph
and a zoomed in portion on the same screen.
From the Home screen, select
Sonar
>
Split Zoom
�
Transducer
frequency
Depth, temperature,
and speed
Range
Zoom
window
Zoomed
depth scale
Zoom level
Split Zoom