HP 507610-B21 Performance factors for HP ProLiant Serial Attached Storage (SAS - Page 11
Performance comparisons based on platter speed, B: Sequential read, Q4
 |
UPC - 884420446675
View all HP 507610-B21 manuals
Add to My Manuals
Save this manual to your list of manuals |
Page 11 highlights
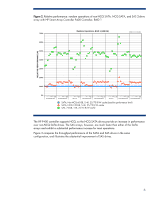
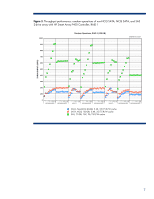
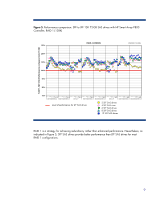
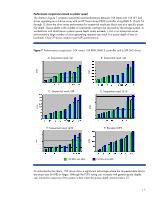
Performance comparisons based on platter speed The charts in Figure 7 compare sequential read performance between 10K (rpm) and 15K SFF SAS drives operating as a 6-drive array with an HP Smart Array P800 controller using RAID 5. Charts 7A through 7E show the drive array performance for sequential reads per block size at a specific queue (Q) depth. Queue depth is the number of commands waiting to be serviced by the storage system. In workstations and small server systems queue depth rarely exceeds 1, but in an enterprise server environment a large number of users generating requests can result in a queue depth of tens or hundreds. Chart 7F shows random read IOPS performance. Figure 7. Performance comparison: 10K versus 15K RPM, RAID 5 controller and 6 SFF SAS drives A: Sequential read, Q1 B: Sequential read, Q4 IOPS IOPS C: Sequential read, Q8 D: Sequential read, Q16 IOPS IOPS E: Sequential read, Q32 F: Random IOPS IOPS IOPS 10K RPM SAS HDD 15K RPM SAS HDD As indicated by the charts, 15K drives show a significant advantage where the requested data blocks are stripe size (64 KB) or larger. Although the IOPS rating can increase with greater queue depths, user interaction response of the system is best when the queue depth remains below 32. 11
-
 1
1 -
2
-
3
-
4
-
5
-
 6
6 -
 7
7 -
 8
8 -
 9
9 -
 10
10 -
 11
11 -
 12
12 -
 13
13 -
 14
14
 |
 |
