HP 516814-B21 Performance factors for HP ProLiant Serial Attached Storage (SAS - Page 5
HDD performance comparisons, Performance comparison between SATA and SAS drives
 |
UPC - 884420695646
View all HP 516814-B21 manuals
Add to My Manuals
Save this manual to your list of manuals |
Page 5 highlights
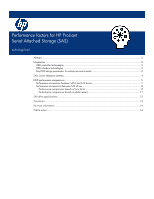
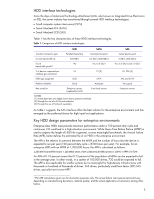
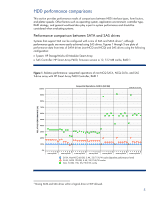
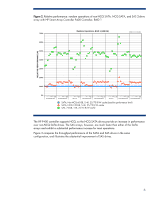
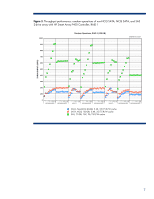
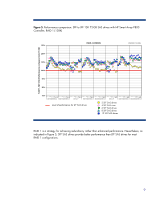
HDD performance comparisons This section provides performance results of comparisons between HDD interface types, form factors, and platter speeds. Other factors such as operating system, application environment, controller type, RAID strategy, and general workload also play a part in system performance and should be considered when evaluating systems. Performance comparison between SATA and SAS drives Systems that support SAS can be configured with a mix of SAS and SATA drives4, although performance goals are more easily achieved using SAS drives. Figures 1 through 3 are plots of performance data from tests of SATA drives (non-NCQ and NCQ) and SAS drives using the following configuration: • System: HP StorageWorks 60 Modular Smart Array • SAS Controller: HP Smart Array P400, firmware version 4.12, 512 MB cache, RAID 1 Figure 1. Relative performance: sequential operations of non-NCQ SATA, NCQ SATA, and SAS 2-drive array with HP Smart Array P400 Controller, RAID 1 RELATIVE PERFORMANCE (%) 1000% Sequential Operations, RAID 1 (128 KB) IOMETER 07.30.2004 900% 800% 700% 600% 500% 400% 300% 200% 100% 64 32 16 8 4 2 1 64 32 16 8 4 2 1 64 32 16 8 4 2 1 64 32 16 8 4 2 1 64 32 16 8 4 2 1 64 32 16 8 4 2 1 64 32 16 8 4 2 1 0% 4KB SEQ READ 64KB SEQ READ 512KB SEQ READ 1MB SEQ READ 4KB SEQ WRITE 64KB SEQ WRITE 512KB SEQ WRITE SATA, Non-NCQ 60-GB, 5.4K, 25/75 R/W cache (baseline performance level) SATA, NCQ 120-GB, 5.4K, 25/75 R/W cache SAS, 72-GB, 15K, 25/75 R/W cache 4 Mixing SATA and SAS drives within a logical drive is NOT allowed. 5
-
 1
1 -
 2
2 -
 3
3 -
 4
4 -
 5
5 -
 6
6 -
 7
7 -
 8
8 -
 9
9 -
 10
10 -
 11
11 -
12
-
13
-
14
 |
 |