HP BL680c HP Insight Control Environment User Guide - Page 57
Displaying the storage status, Displaying the logical drive under network storage
 |
UPC - 884420396314
View all HP BL680c manuals
Add to My Manuals
Save this manual to your list of manuals |
Page 57 highlights
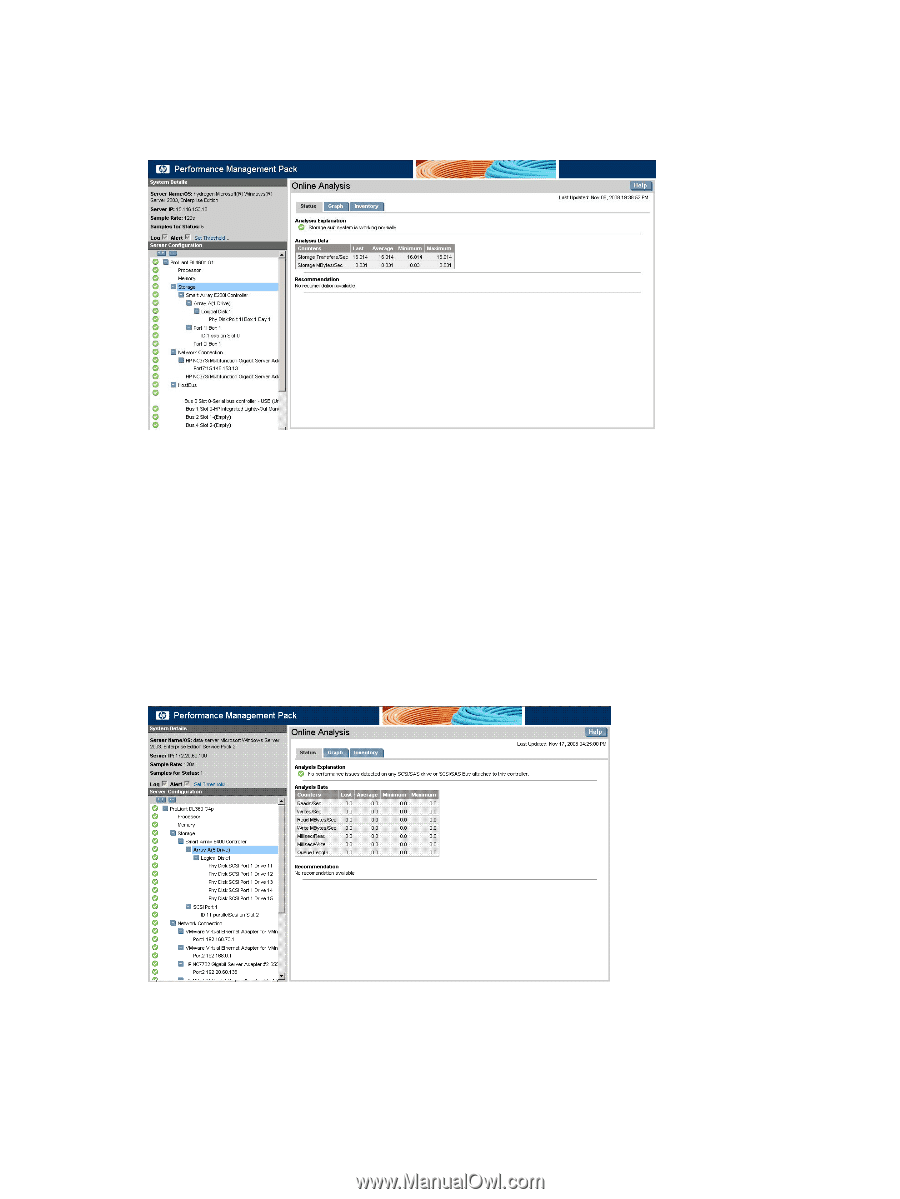
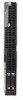
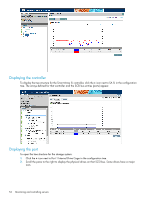
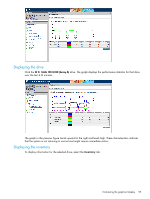
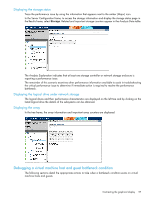
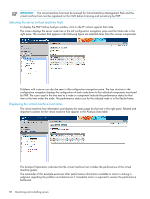
Displaying the storage status Trace the performance issue by using the information that appears next to the amber (Major) icon. In the Server Configuration frame, to access the storage information and display the storage status page in the Results frame, select Storage. Related and important storage counters appear in the Analysis Data table. The Analysis Explanation indicates that at least one storage controller or network storage enclosure is reporting a performance issue. The remainder of this scenario examines other performance information available to assist in troubleshooting the critical performance issue to determine if immediate action is required to resolve the performance bottleneck. Displaying the logical drive under network storage The logical drives and their performance characteristics are displayed on the left tree and by clicking on the listed logical drive the details of the subsystems can be obtained. Displaying the array In the tree frame, the array information and important array counters are displayed. Debugging a virtual machine host and guest bottleneck condition The following sections detail the appropriate actions to take when a bottleneck condition exists on virtual machine hosts and guests. Contrasting the graphical display 57
-
 1
1 -
2
-
3
-
4
-
5
-
6
-
7
-
8
-
9
-
10
-
11
-
12
-
13
-
14
-
15
-
16
-
17
-
18
-
19
-
20
-
21
-
22
-
23
-
24
-
25
-
26
-
27
-
28
-
29
-
30
-
31
-
32
-
33
-
34
-
35
-
36
-
37
-
38
-
39
-
40
-
41
-
42
-
43
-
44
-
45
-
46
-
47
-
48
-
49
-
50
-
51
-
 52
52 -
 53
53 -
 54
54 -
 55
55 -
 56
56 -
 57
57 -
 58
58 -
 59
59 -
 60
60 -
 61
61 -
 62
62 -
63
-
64
-
65
-
66
-
67
-
68
-
69
-
70
-
71
-
72
-
73
-
74
-
75
-
76
-
77
-
78
-
79
-
80
-
81
-
82
-
83
-
84
-
85
-
86
-
87
-
88
-
89
-
90
-
91
-
92
-
93
-
94
-
95
-
96
-
97
-
98
-
99
-
100
-
101
-
102
-
103
-
104
-
105
-
106
-
107
-
108
-
109
-
110
-
111
-
112
-
113
-
114
-
115
-
116
-
117
-
118
-
119
-
120
-
121
-
122
-
123
-
124
-
125
-
126
-
127
-
128
-
129
-
130
-
131
-
132
-
133
-
134
-
135
-
136
-
137
-
138
-
139
-
140
-
141
-
142
-
143
-
144
-
145
-
146
-
147
-
148
-
149
-
150
-
151
-
152
-
153
-
154
-
155
-
156
-
157
-
158
-
159
-
160
-
161
-
162
-
163
-
164
-
165
-
166
-
167
-
168
-
169
-
170
-
171
-
172
-
173
-
174
-
175
-
176
-
177
-
178
-
179
-
180
-
181
 |
 |