HP ML370 Dynamic Power Capping TCO and Best Practices White Paper (EMEA editio - Page 7
Case 2. HP ProLiant BL460c G1 and G5 Servers, Best Practices for Implementing Dynamic Power Capping
 |
UPC - 613326765616
View all HP ML370 manuals
Add to My Manuals
Save this manual to your list of manuals |
Page 7 highlights
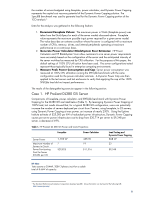
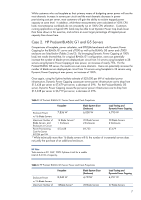
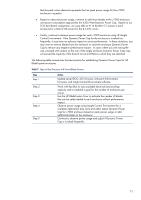
While customers who use faceplate as their primary means of budgeting server power will see the most dramatic increase in servers per circuit and the most dramatic decrease in power provisioning cost per server, most customers will gain the ability to reclaim trapped power capacity at some level. In addition, while these measurements were calculated at 100% CPU load, most enterprise workloads do not consistently run at 100% CPU utilization. Customers running applications at typical CPU loads may be able to set Dynamic Power Cap levels lower than those shown in this exercise, and reclaim an even larger percentage of trapped power capacity than shown here. Case 2. HP ProLiant BL460c G1 and G5 Servers Comparisons of faceplate, power calculator, and SPECjbb benchmark with Dynamic Power Capping for the BL460c G1 server and c7000 as well as the BL460c G5 server and c7000 enclosure are listed below (Tables 2 and 3). By leveraging Dynamic Power Capping at 100% load, test results showed that, for a typical BL460c G1 configuration, users can potentially increase the number of blade servers deployed per circuit from 16 servers using faceplate to 28 servers using Dynamic Power Capping at max power, an increase of nearly 75%. For the ProLiant BL460c G5 server, the results are even more dramatic. Users can potentially increase the number of blade servers deployed per circuit from 16 servers using faceplate to 32 servers using Dynamic Power Capping at max power, an increase of 100%. Once again, using the Uptime Institute estimate of $25,000 per kW of redundant power infrastructure, Dynamic Power Capping causes per server power infrastructure cost to drop from $13,438 per server to $7,679 per server, a decrease of 39%. For the ProLiant BL460c G5 server, Dynamic Power Capping causes the per server power infrastructure cost to drop from $13,438 per server to $6,719 per server, a decrease of 49%. Table 2. HP ProLiant BL460c G1 Server Power and Costs Projections Faceplate Blade System Sizer (Enclosure) Load Testing and Dynamic Power Capping Enclosure Power 7,836 W 6,000 W 4,790 W w/16 Blade Servers Maximum Number of 16 Blade Servers* 20 Blade Servers 28 Blade Servers Blade Servers and 1 Enclosure 2 Enclosures 2 Enclosures Enclosures in Circuit Power Provisioning $13,438 $9,733 $7,679 Cost Per Server @ $25k per kW * While technically more than 16 blade servers will fit, the number of incremental servers does not justify the purchase of an additional enclosure. HP Note Tests assume a 30 AMP, 208V 3-phase circuit for a usable total of 8.6 kW of capacity. Table 3. HP ProLiant BL460c G5 Server Power and Costs Projections Faceplate Enclosure Power w/16 Blade Servers Maximum Number of 8,340 W 16Blade Server* Blade System Sizer (Enclosure) 4,722W 28 Blade Servers Load Testing and Dynamic Power Capping 4,257 W 32 Blade Servers 7
-
 1
1 -
 2
2 -
 3
3 -
 4
4 -
 5
5 -
 6
6 -
 7
7 -
 8
8 -
 9
9 -
 10
10 -
 11
11 -
 12
12 -
13
-
14
-
15
 |
 |
