HP ProLiant DL140 Dynamic Power Capping TCO and Best Practices White Paper (WW - Page 6
The results of the data-gathering exercise appear in the following - specs
 |
View all HP ProLiant DL140 manuals
Add to My Manuals
Save this manual to your list of manuals |
Page 6 highlights
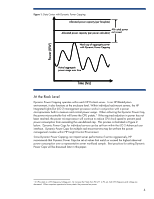
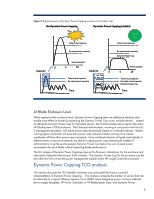
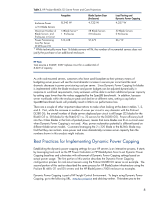
Capping. Comparisons were run using the three power budgeting methods for the ProLiant DL 380 G5 server, ProLiant BL460c G1 server, and ProLiant BL460c G5 server. The difference in the number of servers budgeted using faceplate, power calculator, and Dynamic Power Capping represents the capital cost recovery potential of the Dynamic Power Capping solution. The SpecJBB benchmark was used to generate load for the Dynamic Power Capping portion of the TCO analysis.4 Data for the analysis was gathered in the following fashion: 1. Document Faceplate Values: The maximum power in Watts (faceplate power) was taken from the QuickSpecs for each of the server models discussed above. Faceplate value represents the maximum possible input power required for a given server model. The value describes an extreme condition where the server is configured with a maximum number of CPUs, memory, drives, and internal peripherals operating at maximum performance on a continuous basis. 2. Generate Power Calculator/BladeSystem Sizer Estimates: HP Power Calculator and HP BladeSystem Sizer allow customers to size server power requirements more accurately based on the configuration of the server and the anticipated intensity of the server workload as measured by CPU utilization. For the purposes of this paper, the default settings of 100% CPU utilization have been used. The server configurations tested represent those typically found in enterprise computing environments. 3. Measure Peak Power Consumption and Cap: Server power consumption was measured at 100% CPU utilization running the SPECjbb benchmark with the same configuration used for the power calculator estimate. A Dynamic Power Cap was then applied to the test servers and test enclosures to verify that applying the cap at the 100% SPECjbb load did not impact performance. The results of the data-gathering exercise appear in the following section. Case 1. HP ProLiant DL380 G5 Server Comparisons of faceplate, power calculator, and SPECjbb benchmark with Dynamic Power Capping for the DL380 G5 are listed below (Table 1). By leveraging Dynamic Power Capping at 100% load, test results showed that, for a typical DL380 G5 configuration, users can potentially increase the number of servers deployed per circuit from 7servers, using faceplate, to 23 servers, using Dynamic Power Capping at max power, an increase of nearly 230%. Using the Uptime Institute estimate of $25,000 per kW of redundant power infrastructure, Dynamic Power Capping causes per server power infrastructure cost to drop from $30,714 per server to $9,348 per server, a decrease of 69%. Table 1. HP ProLiant DL 380 G5 Power and Costs Projections Faceplate Power Calculator Server Power Maximum Number of Servers in Circuit Power Provisioning Cost Per Server @ $25k per kW 1,193 W 7 $29,825 435 W 19 $11,316 Load Testing and Dynamic Power Capping 368 W 23 $9,348 4 The Standard Performance Evaluation Corporation develops SpecJBB. More information can be found at the following URL: http://www.spec.org/. 6
-
 1
1 -
 2
2 -
 3
3 -
 4
4 -
 5
5 -
 6
6 -
 7
7 -
 8
8 -
 9
9 -
 10
10 -
 11
11 -
 12
12 -
13
-
14
-
15
 |
 |
