HP StorageWorks 4/256 Brocade Web Tools Administrator's Guide v6.2.0 (53-10011 - Page 84
Event monitoring, Displaying Switch Events
 |
View all HP StorageWorks 4/256 manuals
Add to My Manuals
Save this manual to your list of manuals |
Page 84 highlights
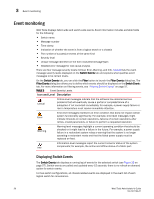
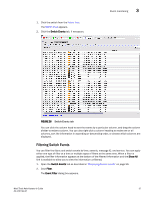
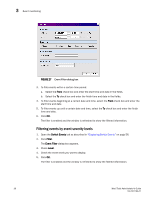
3 Event monitoring Event monitoring Web Tools displays fabric-wide and switch-wide events. Event information includes sortable fields for the following: • Switch name • Message number • Time stamp • Indication of whether the event is from a logical switch or a chassis • The number of successive events of the same kind • Severity level • Unique message identifier (in the form moduleID-messageType) • Detailed error message for root cause analysis There are four message severity levels: Critical, Error, Warning, and Info. Table 8 lists the event message severity levels displayed on the Switch Events tab and explains what qualifies event messages to be certain levels. On the Switch Events tab, you can click the Filter button to launch the Filter Events dialog box. The Filter Events dialog box allows you to define which events should be displayed on the Switch Events tab. For more information on filtering events, see "Filtering Switch Events" on page 57. TABLE 8 Event Severity Levels Icon and Level Description Critical Critical-level messages indicate that the software has detected serious problems that will eventually cause a partial or complete failure of a subsystem if not corrected immediately; for example, a power supply failure or rise in temperature must receive immediate attention. Error Error-level messages represent an error condition that does not impact overall system functionality significantly. For example, error-level messages might indicate timeouts on certain operations, failures of certain operations after retries, invalid parameters, or failure to perform a requested operation. Warning Warning-level messages highlight a current operating condition that should be checked or it might lead to a failure in the future. For example, a power supply failure in a redundant system relays a warning that the system is no longer operating in redundant mode and that the failed power supply must be replaced or fixed. Information-level messages report the current nonerror status of the system Info components; for example, the online and offline status of a fabric port. Displaying Switch Events The Switch Events tab displays a running log of events for the selected switch (see Figure 26 on page 57). Switch events are polled and updated every 15 seconds; there is no refresh-on-demand option for switch events. For two-switch configurations, all chassis-related events are displayed in the event list of each logical switch for convenience. 56 Web Tools Administrator's Guide 53-1001194-01
-
 1
1 -
2
-
3
-
4
-
5
-
6
-
7
-
8
-
9
-
10
-
11
-
12
-
13
-
14
-
15
-
16
-
17
-
18
-
19
-
20
-
21
-
22
-
23
-
24
-
25
-
26
-
27
-
28
-
29
-
30
-
31
-
32
-
33
-
34
-
35
-
36
-
37
-
38
-
39
-
40
-
41
-
42
-
43
-
44
-
45
-
46
-
47
-
48
-
49
-
50
-
51
-
52
-
53
-
54
-
55
-
56
-
57
-
58
-
59
-
60
-
61
-
62
-
63
-
64
-
65
-
66
-
67
-
68
-
69
-
70
-
71
-
72
-
73
-
74
-
75
-
76
-
77
-
78
-
 79
79 -
 80
80 -
 81
81 -
 82
82 -
 83
83 -
 84
84 -
 85
85 -
 86
86 -
 87
87 -
 88
88 -
 89
89 -
90
-
91
-
92
-
93
-
94
-
95
-
96
-
97
-
98
-
99
-
100
-
101
-
102
-
103
-
104
-
105
-
106
-
107
-
108
-
109
-
110
-
111
-
112
-
113
-
114
-
115
-
116
-
117
-
118
-
119
-
120
-
121
-
122
-
123
-
124
-
125
-
126
-
127
-
128
-
129
-
130
-
131
-
132
-
133
-
134
-
135
-
136
-
137
-
138
-
139
-
140
-
141
-
142
-
143
-
144
-
145
-
146
-
147
-
148
-
149
-
150
-
151
-
152
-
153
-
154
-
155
-
156
-
157
-
158
-
159
-
160
-
161
-
162
-
163
-
164
-
165
-
166
-
167
-
168
-
169
-
170
-
171
-
172
-
173
-
174
-
175
-
176
-
177
-
178
-
179
-
180
-
181
-
182
-
183
-
184
-
185
-
186
-
187
-
188
-
189
-
190
-
191
-
192
-
193
-
194
-
195
-
196
-
197
-
198
-
199
-
200
-
201
-
202
-
203
-
204
-
205
-
206
-
207
-
208
-
209
-
210
-
211
-
212
-
213
-
214
-
215
-
216
-
217
-
218
-
219
-
220
-
221
-
222
-
223
-
224
-
225
-
226
-
227
-
228
-
229
-
230
-
231
-
232
-
233
-
234
-
235
-
236
-
237
-
238
-
239
-
240
-
241
-
242
-
243
-
244
-
245
-
246
-
247
-
248
-
249
-
250
-
251
-
252
-
253
-
254
-
255
-
256
-
257
-
258
-
259
-
260
-
261
-
262
-
263
-
264
-
265
-
266
-
267
-
268
-
269
-
270
-
271
-
272
-
273
-
274
-
275
-
276
-
277
-
278
-
279
-
280
-
281
-
282
-
283
-
284
-
285
-
286
-
287
-
288
-
289
-
290
-
291
-
292
-
293
-
294
-
295
-
296
-
297
-
298
-
299
-
300
-
301
-
302
-
303
-
304
-
305
-
306
-
307
-
308
-
309
-
310
-
311
-
312
-
313
-
314
 |
 |
