HP StorageWorks 8/24 Brocade Web Tools Administrator's Guide v6.2.0 (53-100119 - Page 154
Saving graphs to a canvas
 |
View all HP StorageWorks 8/24 manuals
Add to My Manuals
Save this manual to your list of manuals |
Page 154 highlights
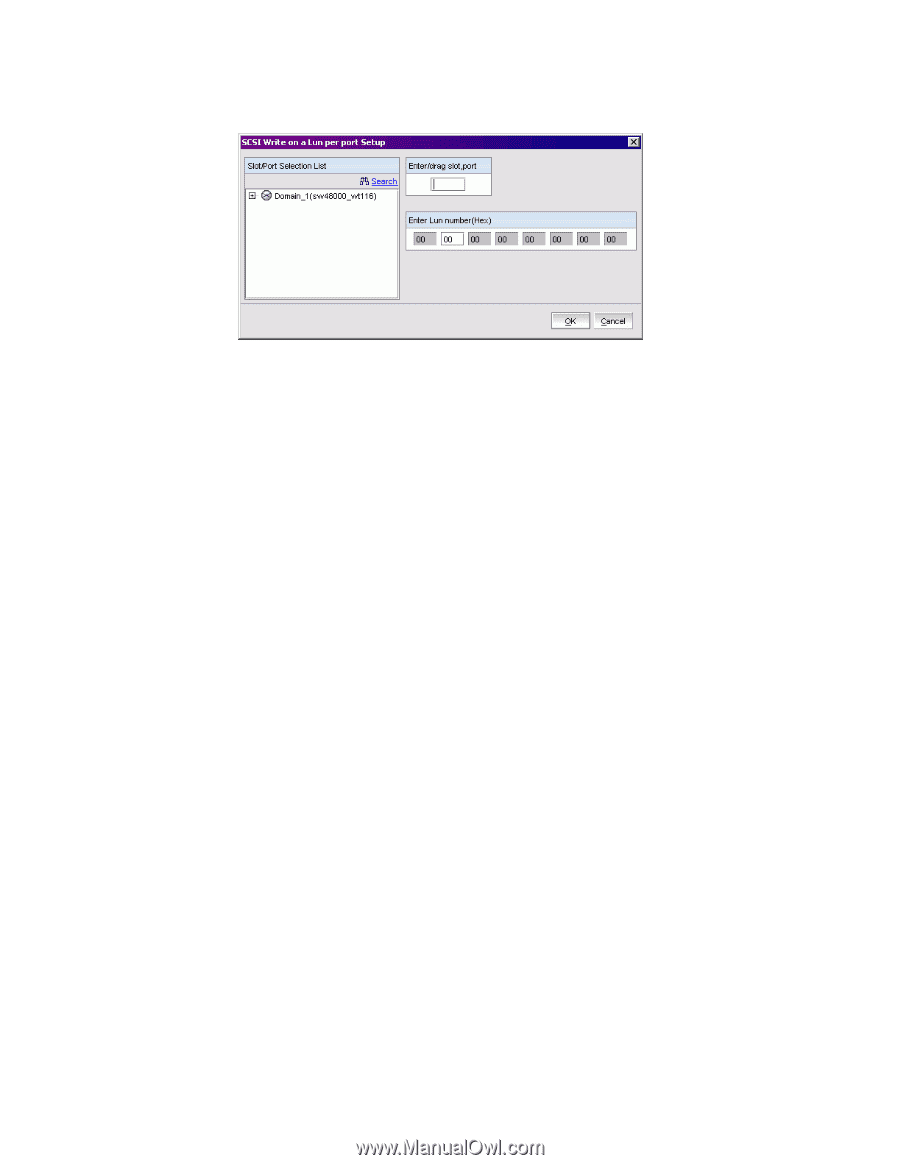
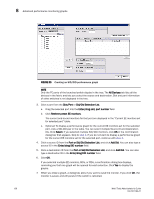
8 Saving graphs to a canvas FIGURE 66 Creating a SCSI command graph 3. Navigate to a switch > slot > port in the Slot/Port Selection List. 4. Click the port from the Slot/Port Selection List and drag it into the Enter/drag slot,port field. 5. Optional: For the LUN per port graphs, type a LUN number, in hexadecimal notation. For the Brocade Encryption Switch you can enter up to eight LUN masks For the Brocade 5100, 5300, 300, you can enter up to eight LUN masks For the Brocade 4100 or 5000 Switch, you can enter up to eight LUN masks. For the Brocade 48000 director, you can enter up to four LUN masks. For all other switches running Fabric OS 4.x or v5.x, you can enter up to two LUN masks. For switches running Fabric OS 3.x, you can enter up to three LUN masks. 6. Click OK. The selected graph is displayed in the canvas. Saving graphs to a canvas Saving graphs is useful when you create customized graphs and do not want to re-create them each time you access the Performance Monitoring window. When you save graphs, you must save them to a canvas. The following procedure describes how to save graphs to a new canvas. 1. Open the Performance Monitoring window. 2. Create basic or advanced Performance Monitor graphs, as described in "Creating basic performance monitor graphs" on page 123 and "Advanced performance monitoring graphs" on page 125. The graphs are displayed in the Performance Monitor window. 3. Click File > Save Current Canvas Configuration. The Save Canvas Configuration dialog box opens. 4. Type a name and description for the configuration and click Save Canvas. A message displays, confirming that the configuration was successfully saved to the switch. 128 Web Tools Administrator's Guide 53-1001194-01
-
 1
1 -
2
-
3
-
4
-
5
-
6
-
7
-
8
-
9
-
10
-
11
-
12
-
13
-
14
-
15
-
16
-
17
-
18
-
19
-
20
-
21
-
22
-
23
-
24
-
25
-
26
-
27
-
28
-
29
-
30
-
31
-
32
-
33
-
34
-
35
-
36
-
37
-
38
-
39
-
40
-
41
-
42
-
43
-
44
-
45
-
46
-
47
-
48
-
49
-
50
-
51
-
52
-
53
-
54
-
55
-
56
-
57
-
58
-
59
-
60
-
61
-
62
-
63
-
64
-
65
-
66
-
67
-
68
-
69
-
70
-
71
-
72
-
73
-
74
-
75
-
76
-
77
-
78
-
79
-
80
-
81
-
82
-
83
-
84
-
85
-
86
-
87
-
88
-
89
-
90
-
91
-
92
-
93
-
94
-
95
-
96
-
97
-
98
-
99
-
100
-
101
-
102
-
103
-
104
-
105
-
106
-
107
-
108
-
109
-
110
-
111
-
112
-
113
-
114
-
115
-
116
-
117
-
118
-
119
-
120
-
121
-
122
-
123
-
124
-
125
-
126
-
127
-
128
-
129
-
130
-
131
-
132
-
133
-
134
-
135
-
136
-
137
-
138
-
139
-
140
-
141
-
142
-
143
-
144
-
145
-
146
-
147
-
148
-
 149
149 -
 150
150 -
 151
151 -
 152
152 -
 153
153 -
 154
154 -
 155
155 -
 156
156 -
 157
157 -
 158
158 -
 159
159 -
160
-
161
-
162
-
163
-
164
-
165
-
166
-
167
-
168
-
169
-
170
-
171
-
172
-
173
-
174
-
175
-
176
-
177
-
178
-
179
-
180
-
181
-
182
-
183
-
184
-
185
-
186
-
187
-
188
-
189
-
190
-
191
-
192
-
193
-
194
-
195
-
196
-
197
-
198
-
199
-
200
-
201
-
202
-
203
-
204
-
205
-
206
-
207
-
208
-
209
-
210
-
211
-
212
-
213
-
214
-
215
-
216
-
217
-
218
-
219
-
220
-
221
-
222
-
223
-
224
-
225
-
226
-
227
-
228
-
229
-
230
-
231
-
232
-
233
-
234
-
235
-
236
-
237
-
238
-
239
-
240
-
241
-
242
-
243
-
244
-
245
-
246
-
247
-
248
-
249
-
250
-
251
-
252
-
253
-
254
-
255
-
256
-
257
-
258
-
259
-
260
-
261
-
262
-
263
-
264
-
265
-
266
-
267
-
268
-
269
-
270
-
271
-
272
-
273
-
274
-
275
-
276
-
277
-
278
-
279
-
280
-
281
-
282
-
283
-
284
-
285
-
286
-
287
-
288
-
289
-
290
-
291
-
292
-
293
-
294
-
295
-
296
-
297
-
298
-
299
-
300
-
301
-
302
-
303
-
304
-
305
-
306
-
307
-
308
-
309
-
310
-
311
-
312
-
313
-
314
 |
 |